
Economic Indicators | Definition, Types, Why It Matters?


Investors often search the markets for reliable signs to make smart decisions quickly and with some planned risk. Economic indicators, which are data that provide insights into the current state of the economy and its future direction.
These indicators help investors predict market changes fairly well and understand the risks involved in their trades more clearly now.
In this blog, let us break down economic indicators, key examples to watch, and explore the good and bad sides of using them in your investment strategy.
What Are Economic Indicators?
Economic indicators are the statistical measures that show how the economy is performing in a particular time period. Governments and central banks regularly release data on various metrics like jobs, inflation, and how people are spending money in different industries.
Investors depend on these indicators to understand the state of the economy, as this information directly influences stock market decisions.
Types Of Economic Indicators
Economic indicators often matter to investors and the broader economy. Let us take a deep look at what the different economic indicators are:

1. Leading Indicators:
Leading indicators often show slight changes before the economy shifts into a particular pattern or reveals hidden trends. They help predict economic activity and are useful for investors who want to spot market changes early. For example, Consumer Price Index (CPI), interest rates, bond yields, etc.
2. Lagging indicators
Lagging indicators change slowly after the economy has already started following a certain trend over time. These indicators confirm what has already happened and give insight into how strong and lasting the trend might be. For example, socio economic indicators like the unemployment rate or cumulative exports.
3. Coincident indicators
Coincident indicators change quickly along with the economy in real time. They provide up-to-date snapshots of how the economy is performing and are useful for understanding its current state. Examples include strong measures like gross domestic product (GDP) and industrial production, along with retail sales.
Key Economic Indicators Investors Should Track
Now that we have understood what are economic data and indicators, let us now have a look at the key indicators that can be helpful:
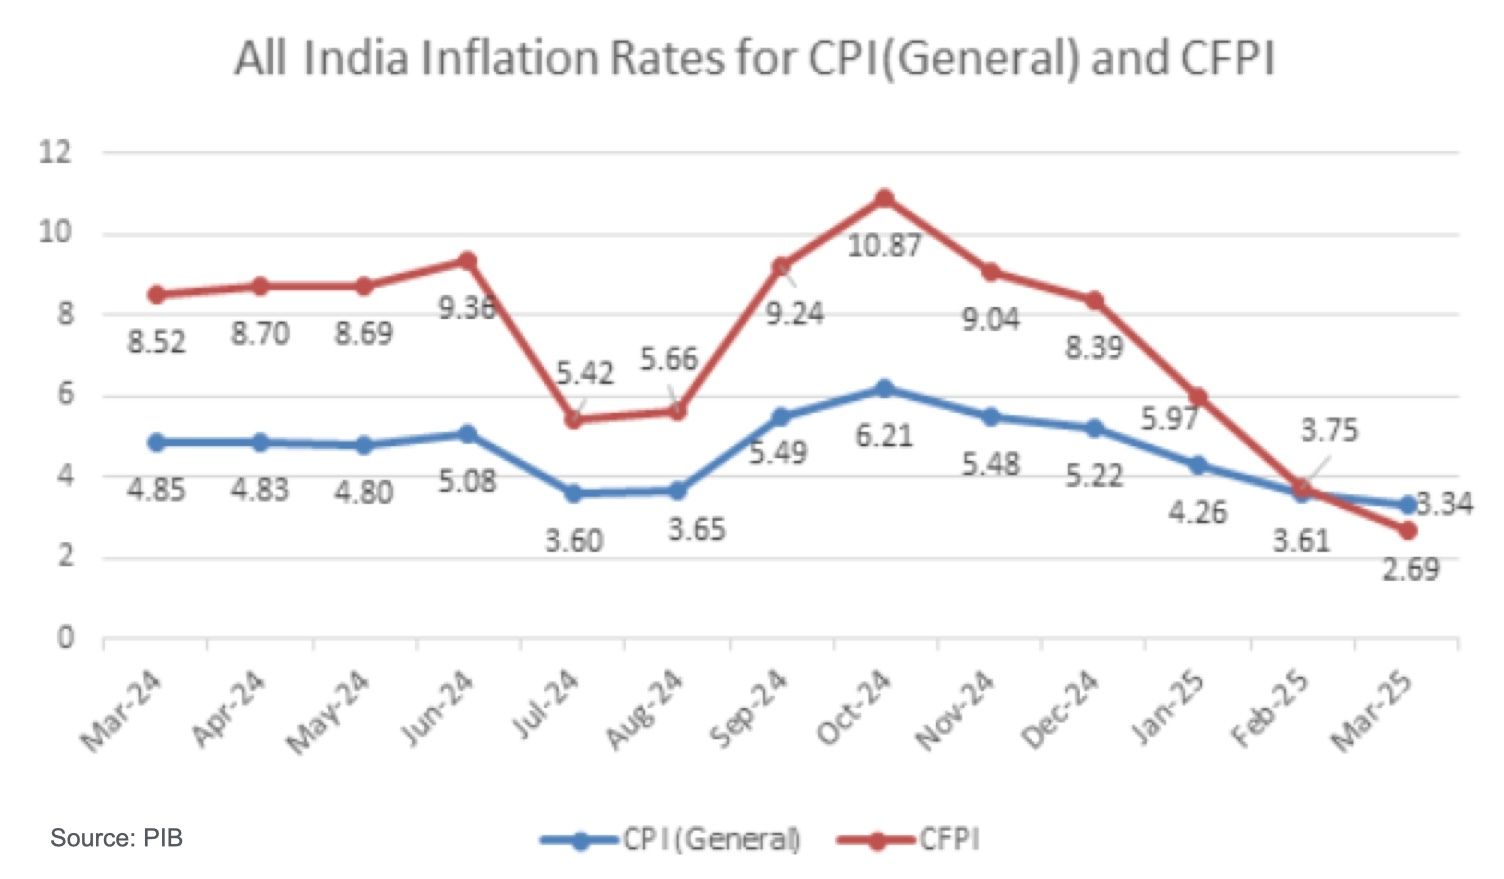
1. CPI
The Consumer Price Index (CPI) measures inflation by tracking changes in the prices of a standard basket of goods and services like cost of food, housing, and transportation over time. Moderate inflation can help boost economic activity, but very high inflation severely reduces people’s buying power and can badly affect the stock market.
India’s CPI for March 2025 was reported at 3.34%, which is a month's low, and for the full year 2025-2026, the CPI is projected at 4% during the April 2025 RBI meeting1. This may act as a healthy indicator for investors as it helps preserve the purchasing power of money and reduces the cost of borrowing2.
2. Interest Rates
Interest rates set by central banks strongly affect borrowing costs across the economy. High rates help to manage inflation, whereas low rates usually give a big boost to economic activity.
The current interest rate in India is 6%, following two consecutive cuts of 25 basis points each in the February and April 2025 RBI meetings3. These rate cuts were made to support the economy and also because inflation had come under control.

3. Unemployment Rate
The unemployment rate, a socio economic indicator, tracks the percentage of people in the labour force that are searching for jobs. It shows how many people are struggling to find work and gives insight into how well the economy is creating jobs. The unemployment rate fell to 3.2% in 2023-2024, down from 6% in 2017-20184.
4. GDP
GDP measures the total value of goods and services provided within a country. It is a broad indicator that is often linked to the overall health of the economy. A rising GDP usually signals strong economic activity, while a falling GDP often points to a serious slowdown or recession.
India's GDP grew by 6.2% in the third quarter of the financial year 2024-20255. This increase was mainly due to strong rural demand. This signals to investors that the economy is expanding and potentially investment opportunities could open for them.

5. PMI
The Purchasing Managers' Index (PMI) is one of the important economic indicators that shows how healthy a country’s manufacturing sector is, and the services sector too. India’s PMI rose to 58.2 in April 2025, driven by a surge in purchasing activity and new orders, which pushed input inventories to an eight-month high6.

6. Bond Yields
Bond yields are influenced by changes in bond prices. When bond prices rise, yields fall, and when bond prices drop, yields increase. These bond yields can help to predict the trends in fixed-income and equity markets.
A fall in bond yields can be concerning for bond investors, as it often indicates rising bond prices due to increased demand.
As shown in the data below, due to the ongoing tariff war and global trade tensions, the demand for fixed-income instruments increased because their returns are fixed. As a result, bond yields decreased. At the same time, equity markets also dropped, with the Nifty falling from a high of 26,000 in September 2024 to a low of 21,776 in April 2025.

We can also see that bond yields, which were above 7% in 2024, have now corrected and are at 6.4% as of May 9, 20257.

7. Consumer Confidence
The Consumer Confidence Index (CCI) measures how optimistic or pessimistic consumers are about the economy’s future. High consumer confidence typically leads to more spending and economic growth, while a sharp decline can signal potential economic downturns.
India’s recent Consumer Confidence Index for March 2025 was reported at 95.5, continuing an upward trend over the past 3 to 4 years which may potentially be positive for the investors8.

8. Cumulative Exports
Cumulative exports refer to the total value of goods and services a country has exported over a specific period. Higher exports are generally better for the country’s economy. For the period April 2024 to January 2025, India’s cumulative exports were estimated at USD 682.59 billion, showing a growth of 7.21% compared to the same period previous year9.
How To Interpret Economic Indicators
Just looking at indicators would not bring much benefit. Investors also need to understand how to interpret them and how they connect with future events. Let us look at some key ways to do that:
1. Historical View: Understanding what happened in the past and comparing it with current events can help predict future outcomes, since we know how things unfolded before.
2. Analysing Trends: Looking at just one number is not enough; it is important to examine the full trend over a specific period to understand what is happening.
3. Market Expectations: Markets react to surprises. If inflation (CPI) was expected to rise by 0.3% but goes up by 0.5%, markets may respond negatively, even though the difference seems small.
4. Multiple Indicators: Various indicators are used to assess the overall health of the economy. For instance, strong GDP, lower unemployment, and rising inflation (CPI) together could mean the economy is overheating, possibly leading the central bank to raise interest rates.
5. Monitor Global Factors: Not just domestic, but global factors also need to be considered. For example, changes in interest rates by the U.S. The Federal Reserve can impact economies around the world.
Pros And Cons Of Using Economic Indicators
Although economic indicators are helpful, they are still just signals and come with their pros and cons. Let us understand them in detail.
Pros
- Informed Decision-Making: They offer fact-based analysis that minimises dependence on speculation or emotion.
- Macro-Level Understanding: Macroeconomic indicators place market movements into perspective, enabling investors to grasp the larger context.
- Timing Advantage: Leading indicators can facilitate forecasting of market turns and provide impetus for proactive portfolio realignment.
- Risk Management: Investors can more effectively manage risk exposure to various asset classes by monitoring economic conditions.
Cons
- Lagging or Delayed Data: A few indicators, such as unemployment, show previous conditions and are less useful for decisions that look to the future.
- Revisions and Errors: First reports usually get revised afterwards, which alters interpretations and generates market volatility.
- Market Overreactions: Markets tend to overreact to a few indicators due to media excitement or investor mood.
- Complex Interactions: These macroeconomic indicators do not move independently, and their interpretations need to understand their interactions.
Conclusion
Economic indicators are essential tools for investors seeking to understand how various factors impact financial markets. By interpreting these indicators, investors can gain insights that may inform their investment decisions. However, it’s important to remember that no single indicator guarantees future outcomes; they merely serve as predictive signals or trends.
Therefore, investors should consider a combination of indicators to form a well-rounded view and fully grasp their potential impact. For comprehensive guidance and access to diversified investment opportunities, explore Grip Invest today.
FAQs On Economic Indicators
1. How may economic indicators assist in investment timing?
Understanding what economic data and indicators will give an early indication of economic growth or decline. Through monitoring these trends, investors can position their portfolios before significant market changes, limiting downside risk and taking advantage of growth possibilities before they are generally accepted in the market.
2. How may economic indicators assist in investment timing?
Leading economic indicators give an early indication of economic growth or decline. Through monitoring these trends, investors are able to position their portfolios before significant market changes, limiting downside risk and taking advantage of growth possibilities before they are generally accepted in the market.
3. Can economic variables affect central bank actions?
Yes, Central banks track measures such as inflation (CPI), unemployment rates, and GDP growth to inform monetary policy choices. These observations influence whether or not to raise or lower interest rates, which subsequently impact borrowing, spending, investing, and financial markets
References:
1. Reuters, accessed from: https://www.reuters.com/world/india/view-indias-retail-inflation-slows-over-5-year-low-march-2025-04-15/
2. Livemint, accessed from: https://www.livemint.com/market/stock-market-news/rbi-monetary-policy-central-bank-projects-inflation-at-4-for-fy26-11744171036646.html
3. The Economic Times, accessed from: https://economictimes.indiatimes.com/wealth/borrow/rbi-cuts-repo-rate-by-25-bps-borrowers-can-rejoice-as-their-home-loan-emi-comes-down-further/articleshow/120114503.cms?from=mdr
4. Labour Market Indicators, accessed from: https://labour.gov.in/sites/default/files/pib2097939.pdf
5. The Economic Times, accessed from: https://economictimes.indiatimes.com/news/economy/indicators/indias-q3-gdp-growth-quickens-to-6-2-on-rural-demand-govt-spending-but-is-all-well-ahead/articleshow/118621118.cms?from=mdr
6. The Economic Times, accessed from: https://cfo.economictimes.indiatimes.com/news/economy/indias-manufacturing-momentum-holds-strong-with-pmi-at-58-2-in-april/120812780
7. Trading Economics, accessed from: https://tradingeconomics.com/india/government-bond-yield
8. Consumer Confidence Survey, accessed from: https://rbidocs.rbi.org.in/rdocs/Publications/PDFs/CCS09042025205F2DB144B6451FAFBB282D6E3EA9EA.PDF
9. Ministry of Commerce & Industry, accessed from: https://www.pib.gov.in/PressReleasePage.aspx?PRID=2104150
Want to stay at the top of your finances?
Join the community of 4 lakh+ investors and learn more about Grip Invest, the latest financial knick-knacks, and shenanigans in the world of investing.
Happy Investing!
Disclaimer - Investments in debt securities/municipal debt securities/securitised debt instruments are subject to risks including delay and/ or default in payment. Read all the offer related documents carefully. The investor is requested to take into consideration all the risk factors before the commencement of trading.
This communication is prepared by Grip Broking Private Limited (bearing SEBI Registration No. INZ000312836 and NSE ID 90319) and/or its affiliate/ group company(ies) (together referred to as “Grip”) and the contents of this disclaimer are applicable to this document and any and all written or oral communication(s) made by Grip or its directors, employees, associates, representatives and agents. This communication does not constitute advice relating to investing or otherwise dealing in securities and is not an offer or solicitation for the purchase or sale of any securities. Grip does not guarantee or assure any return on investments and accepts no liability for consequences of any actions taken based on the information provided. For more details, please visit www.gripinvest.in
Registered Address - 106, II F, New Asiatic Building, H Block, Connaught Place, New Delhi 110001


