

Bond Yield Curve Inversion: Meaning, Causes And Economic Impact



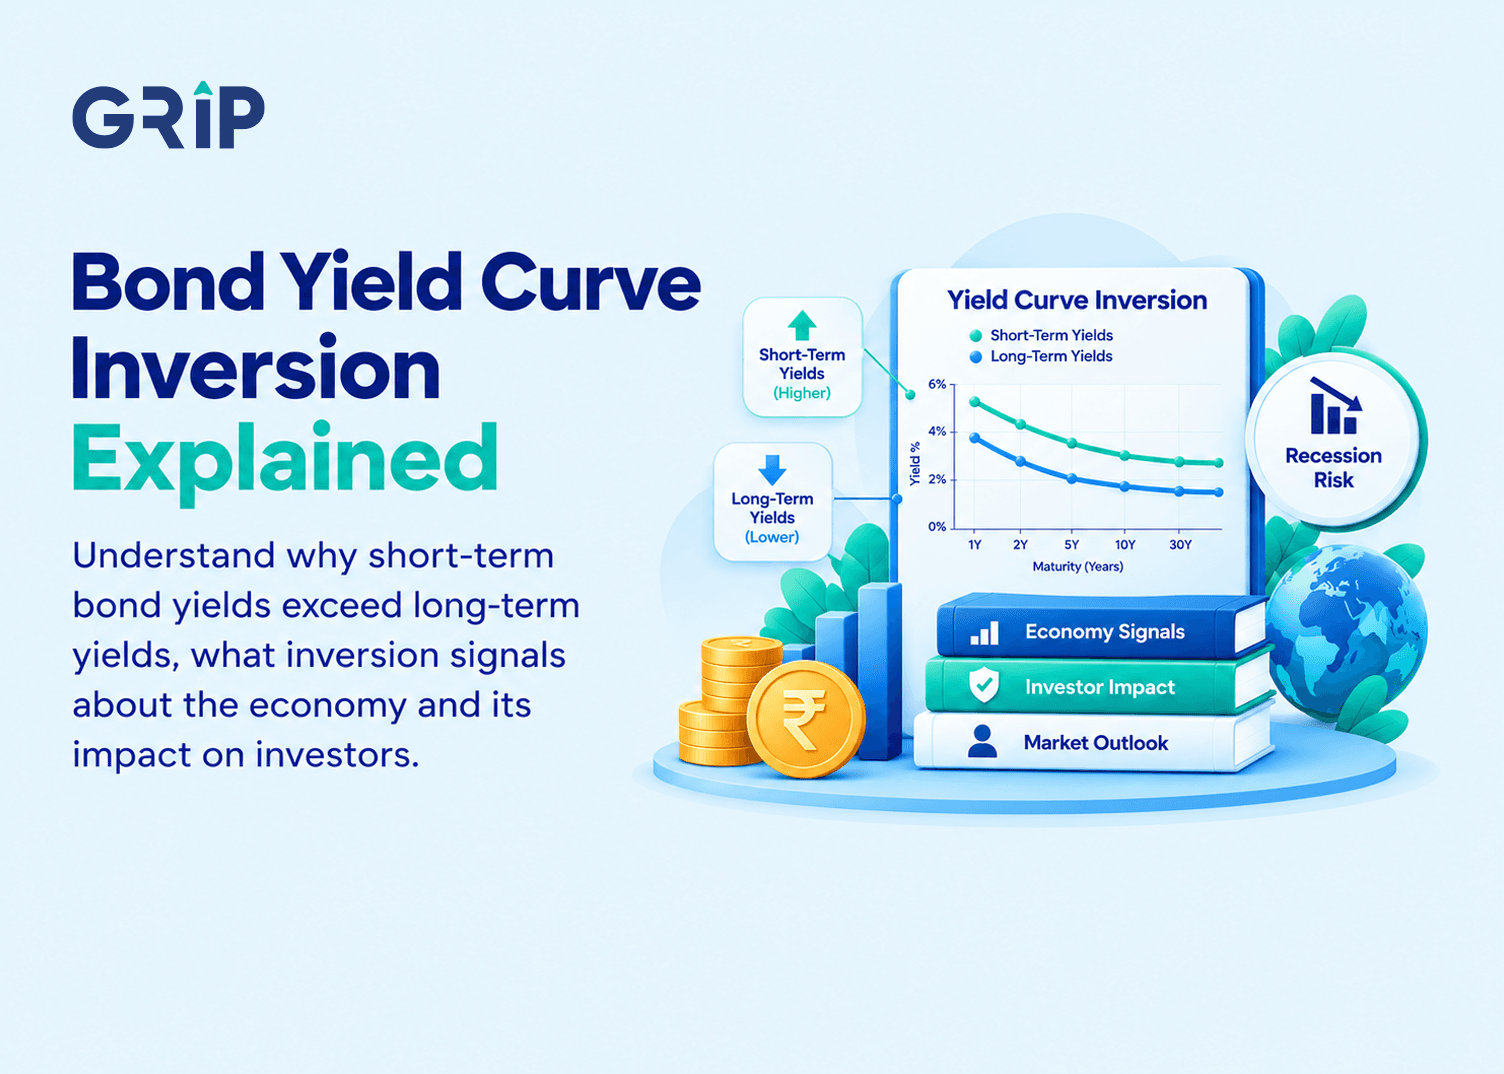
Bond Yield Curve Inversion happens when short-term government bonds offer higher yields than long-term bonds. Normally, investors expect more yield for holding bonds for longer.
When this pattern reverses, it may mean the market expects interest rates to fall. But that does not tell the whole story. What causes the reversal matters, especially when investors have to decide which bonds to hold.
What Is A Bond Yield Curve?
Investors use a bond yield curve to compare yields across different maturities and understand interest-rate expectations. It plots the yields of comparable government securities (like G-Secs in India) on the same date, with maturity on the horizontal axis and yield on the vertical axis.
For example, consider the following hypothetical yields:
G-Sec maturity | Yield |
2 years | 6.80% |
5 years | 7.00% |
10 years | 7.20% |
Plotting these yields produces an upward-sloping curve. This means investors demand higher yields for holding longer-maturity bonds, generally because of greater interest-rate uncertainty and the risks associated with lending for longer periods.
What Is An Inverted Yield Curve?
Yield curve inversion meaning the opposite of a normal yield curve. It occurs when short-term government bonds offer higher yields than long-term bonds. Like in the US on 3 July 2023, the 2-year Treasury yield stood at 4.94% vs 3.86% for the 10-year maturity, producing a negative spread of 108 basis points.1
To understand how this works, consider this hypothetical example
G-Sec maturity | Yield |
2 years | 7.20% |
5 years | 7.00% |
10 years | 6.80% |
The curve now slopes downwards. The 10-year minus 2-year yield spread is 6.80% -7.20%= ?0.40 percentage points, or ?40 basis points.
This means investors are getting higher yields on shorter-maturity bonds despite committing their money for less time. It may suggest that the market expects today's higher interest rates to fall in the coming years, possibly due to slower economic growth.
Normal Vs Flat Vs Inverted Yield Curve
Apart from normal and inverted yield curves, there is also a flat yield curve. Here, short-term and long-term government bonds offer almost the same yield. Like the 10-year vs 1-year G-Sec yield spread fell from 147 basis points at end-March 2026 to 124 basis points at end-June 2026.2 The gap became smaller, but it was still positive. This means the curve was getting flatter, not that it had become flat or inverted.
Using the earlier hypothetical examples, let us assume that all three G-Sec maturities offer the same 7% yield for the flat curve.
Beyond their shapes, each curve tells investors something different about bond yields and market expectations.
Parameter | Normal Yield Curve | Flat Yield Curve | Inverted Yield Curve |
Shape | Slopes upwards | Almost flat | Slopes downwards |
Bond yields | Long-term yields are higher | Yields are almost equal | Short-term yields are higher |
Yield spread | Positive | Near zero | Negative |
What it suggests | Investors demand more yield for holding longer-term bonds | Markets are uncertain about future interest rates | Investors may expect interest rates to fall |
What Causes A Bond Yield Curve Inversion?
A yield curve can invert when short-term bond yields rise faster than long-term yields or when long-term yields fall. Several factors can lead to this.
- Higher policy interest rates: Central banks raise interest rates to control inflation. When this happens, short-term bond yields usually rise faster because they are closely linked to current interest rates. Long-term yields may not rise as much if investors expect rates to come down later. This can make the curve flatten or even invert.
- Expectations of slower growth and rate cuts: Higher interest rates make borrowing expensive for businesses and households. This can slow down spending and economic growth. Investors may then expect the central bank to cut rates in the coming years. As a result, long-term bond yields may remain lower than short-term yields, even before any rate cut happens.
- Higher demand for long-term bonds: When investors expect interest rates to fall, they may prefer buying long-term bonds to secure the current yields. More buyers push bond prices up. Since bond prices and yields move in opposite directions, long-term yields fall. If they drop below short-term yields, the curve inverts.
- Changes in the term premium: Investors usually want some extra yield for holding bonds for longer because future interest rates and inflation are uncertain. This extra yield is called the term premium. When investors demand less of this extra return, long-term yields may fall, making an inversion more likely.
These factors can work together. Short-term yields may stay high because of current interest rates, while long-term yields remain low because investors expect rates to fall in the future.
What Does Yield Curve Inversion Indicate About The Economy?
An inverted yield curve can point to trouble ahead for the economy. But it does not mean a slowdown or recession is certain. Here is what it may indicate:
- Slower economic growth: Investors may expect interest rates to fall because businesses and consumers could cut back on spending. Lower spending means weaker demand, which can slow business activity, investment and job creation.
- Tighter lending conditions: Banks that borrow at higher short-term rates but lend at lower long-term rates may earn less from lending. This reduces their lending margins and may make them more cautious about giving loans to businesses and households.
- Yield curve recession indicator: An inversion can warn of a possible recession when economic activity falls across several sectors. But it is not always right. In the US, the 10-year vs 3-month Treasury yield spread turned negative in August 2006. A recession began 16 months later, in December 2007, and lasted 18 months.3 However, the same spread remained inverted from late 2022 to late 2024, yet the US economy avoided recession and recorded 3% real GDP growth in 2024.4,5
These two cases show why inversion is a warning, not a prediction. The same applies when looking at India. Its bond yields respond to RBI policy, domestic inflation and government borrowing.
How Does Yield Curve Inversion Affect Bond Investors?
An inverted yield curve affects bond investors differently depending on how long they plan to stay invested. A higher yield today may look attractive, but what happens later matters too.
- Short-term bonds: The main concern is what happens after maturity. Suppose an investor buys a 2-year Indian G-Sec in 2026 at a hypothetical yield of 7.2%. By the time it matures in 2028, new 2-year G-Secs might offer only 5%. The investor gets the money back at maturity but now has to reinvest at a lower yield. This is reinvestment risk.
- Long-term bonds: During an inversion, long-term bonds may offer lower yields than short-term bonds. Still, investors may choose them if they expect interest rates to fall. For example, a 10-year G-Sec bought at a hypothetical 7% yield could gain market value if yields later drop to 6%. This gives investors a chance to sell at a higher price. But if yields rise instead, selling before maturity could mean a loss.
- Corporate bonds: Higher yields alone do not make them better investments. Investors still need to check the issuer's ability to repay, along with liquidity and maturity.
Therefore, before choosing a bond during an inversion, investors should ask:
- When will I need the money? Choose a maturity that matches the investment period to reduce the need for early selling.
- What happens when the bond matures? Consider whether the proceeds may have to be reinvested at lower yields.
- Can I handle price changes? Longer-duration bonds can see larger price movements, particularly if sold before maturity.
- Is the higher yield worth the risk? For corporate bonds, check the issuer's credit quality and how easily the bond can be sold.
FAQs

Want to stay at the top of your finances?
Join the community of 22 lakh+ investors and learn more about Grip Invest, the latest financial knick-knacks, and shenanigans in the world of investing.
Happy Investing!
Disclaimer - Investments in debt securities/municipal debt securities/securitised debt instruments are subject to risks including delay and/ or default in payment. Read all the offer related documents carefully. The investor is requested to take into consideration all the risk factors before the commencement of trading.
This communication is prepared by Grip Broking Private Limited (bearing SEBI Registration No. INZ000312836 and NSE ID 90319) and/or its affiliate/ group company(ies) (together referred to as “Grip”) and the contents of this disclaimer are applicable to this document and any and all written or oral communication(s) made by Grip or its directors, employees, associates, representatives and agents. This communication does not constitute advice relating to investing or otherwise dealing in securities and is not an offer or solicitation for the purchase or sale of any securities. Grip does not guarantee or assure any return on investments and accepts no liability for consequences of any actions taken based on the information provided. For more details, please visit www.gripinvest.in
Registered Address - 106, II F, New Asiatic Building, H Block, Connaught Place, New Delhi 110001


