

Large Cap Funds Continue To Underperform: Is the Shift Towards Small Cap Funds Sustainable?


Smaller firms may be able to continue to beat larger firms, but this will depend upon whether their earnings growth supports their higher valuations. To do this, mid caps and small caps have to have strong earnings, see domestic investors come into the market, and have momentum on their side. Meanwhile, large caps saw earnings growth slow down and face headwinds due to intense selling by foreign investors.
However, this does not mean that market participants will see a permanent change in leadership among companies. Indeed, earnings, valuations and fund flows can be powerful enough to change the gap between the performance of large caps, mid caps and small caps in near future as well as the long term.
Large Cap Underperformance: What Is Happening in 2026?
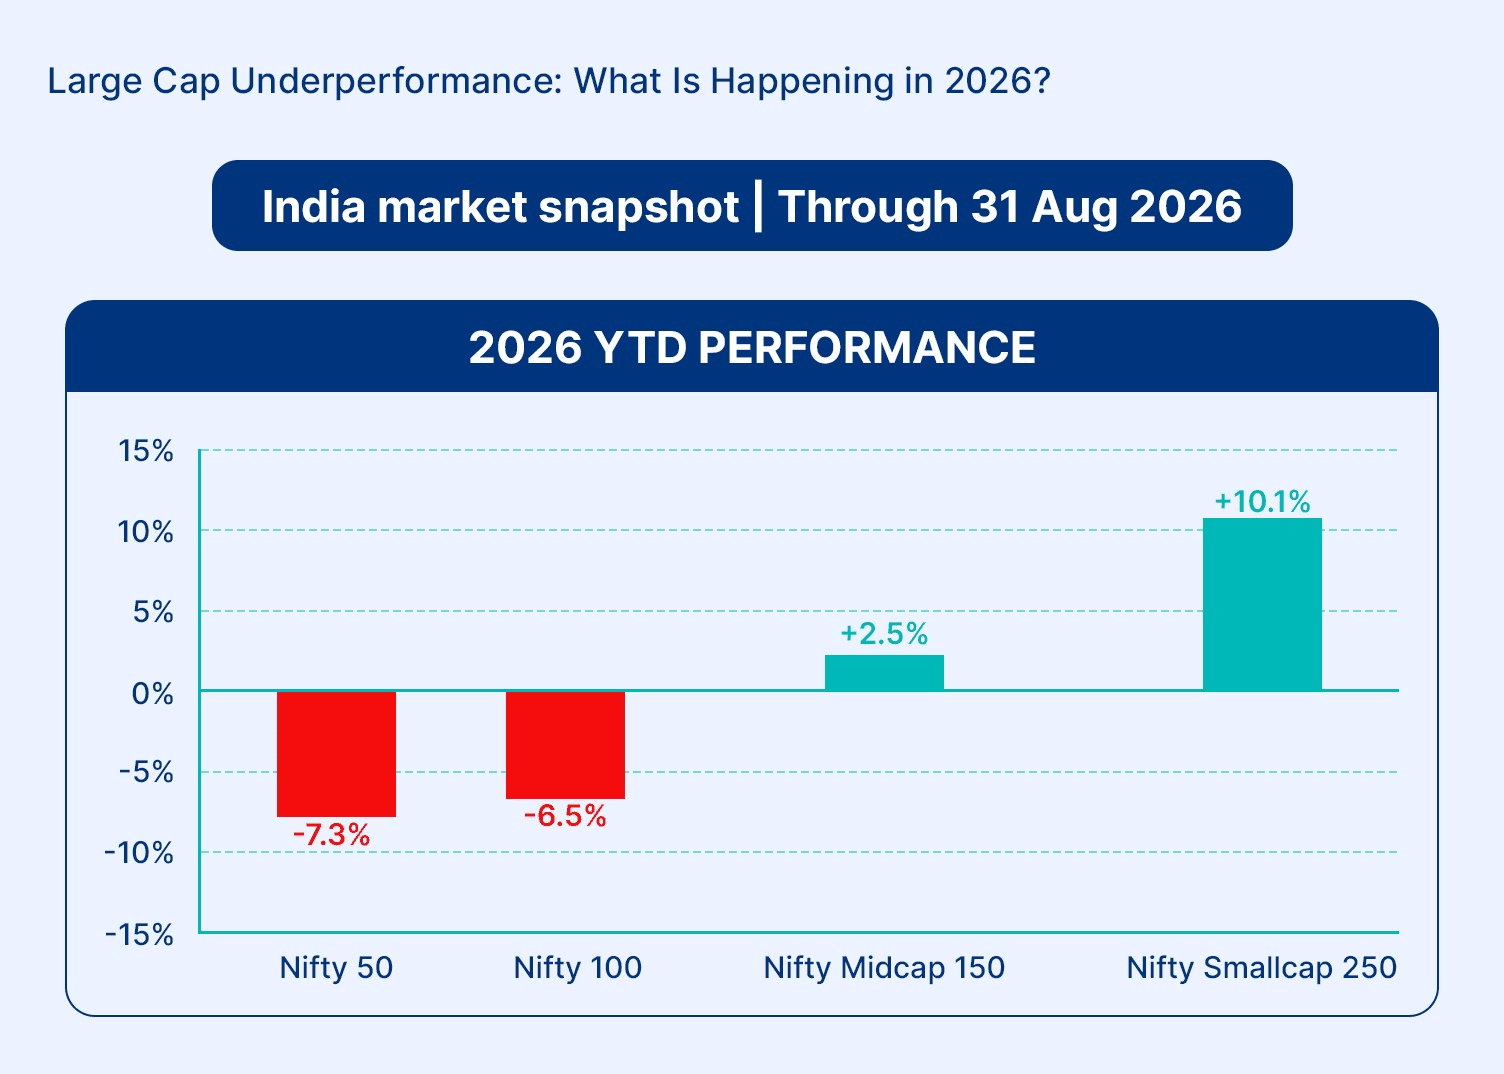
The difference became apparent in the first eight months of 2026. By 31 August, the Nifty 50 index was down around 7.3% from the last closing at the end of December 2025, while Nifty Smallcap 250 was up around 10.1% by price.
The Nifty Midcap 150 also recovered more strongly than the large-cap benchmarks. Its performance sat between the two extremes.
The closing value of the Nifty 50 was 26,129.60 on December 31, 2025, and 24,080.40 on August 31, 2026. The Nifty Smallcap 250 ranged between 16,684.75 and 18,372.10 over the same time period.
These index returns should not be confused with the performance of large cap mutual funds. Both indices and fund performance measure stock movements. However, the index tracks the movements of its stocks according to a set rule base while the active fund is able to pick and adjust its securities according to the limit imposed. The returns of a mutual fund also depend on the costs and decisions made by the fund manager.
Why Have Large Caps Been Underperforming?
The performance gap can be understood through three separate lenses.
1. Earnings
The ultimate basis for stock prices lies in profits. At various times in 2026, some of the small caps saw major profit growth because of their better domestic demand and operating leverage. The big companies had much higher exposure to global trade, technological expenditures, commodity prices, etc. This gap is not permanent. Leadership can reverse once large-cap earnings recover, and small-cap growth slows.
2. Valuations
A good company can still produce a disappointing investment return when bought at an excessive price. Mid-cap and small-cap businesses often trade at higher price-to-earnings multiples because investors expect faster growth.
In late July 2026, the Nifty 50 traded near 20.5 times earnings, compared with approximately 30.1 times for the Nifty Midcap 150 and 34 times for the Nifty Smallcap 250. The higher multiples do not automatically mean these stocks must fall. They mean future earnings have less room to disappoint.
3. Fund flows
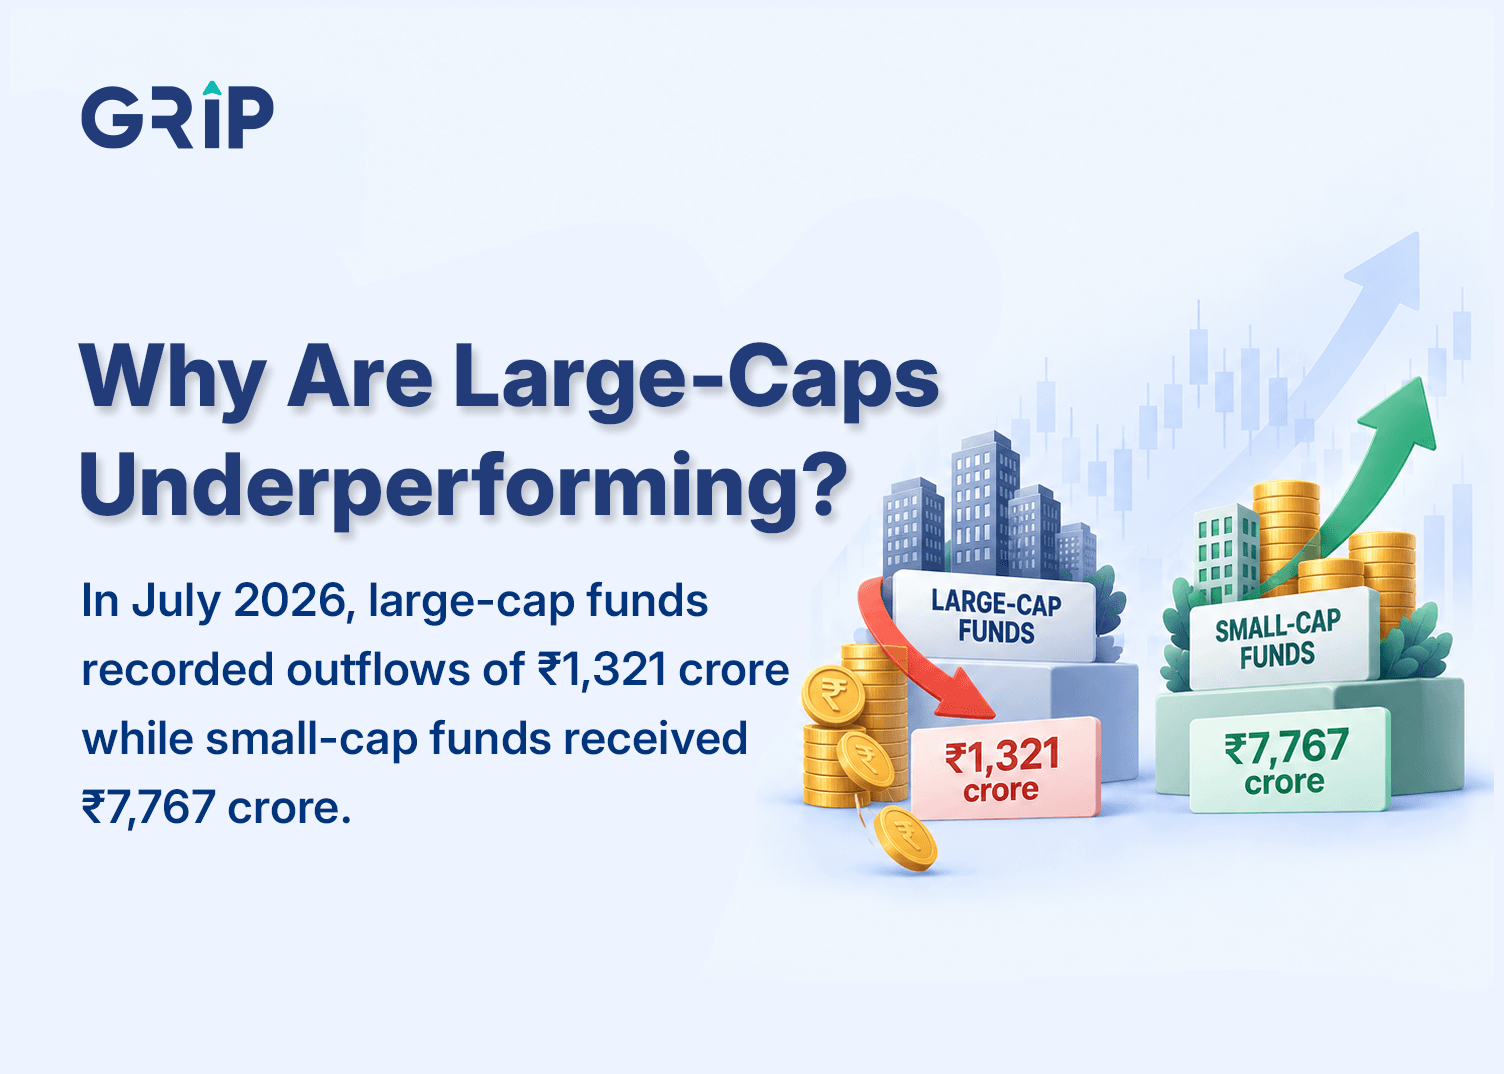
Money entering or leaving a category can influence prices before business fundamentals change. In July 2026, large-cap mutual funds recorded net outflows of ?1,321 crore. Small-cap funds received ?7,767 crore, and mid-cap funds attracted ?6,192 crore.
Foreign investors typically have greater exposure to liquid large-cap stocks. Their withdrawals earlier in the year therefore affected the largest companies more directly. Domestic investment flows, including SIPs, provided stronger support to the broader market.
Is the Large Cap Discount Actually an Opportunity?
Lower valuations can create an opportunity, but only when earnings remain dependable. A low multiple accompanied by repeated profit downgrades may be a value trap rather than a bargain.
Factor | Large caps | Midcaps | Small caps |
| Indicative P/E in late July 2026 | 20.5x | 30.1x | 34.0x |
| Earnings expectation | Moderate, with scope for recovery | Stronger but already priced in | Uneven across companies |
| Liquidity | Generally high | Moderate | Can reduce sharply during corrections |
| Margin of safety | Relatively better | Selective | Limited where valuations are stretched |
| Main risk | Slow earnings recovery | Growth disappointment | Valuation and liquidity correction |
In the above large cap vs. mid cap valuation, large-cap valuation looks more comfortable on a relative basis. That alone is not a buy signal. Investors should check whether revenue growth, margins, and earnings estimates are stabilising before treating the discount as an opportunity.
Can Smaller Companies Continue to Outperform?
A simple four-part test can help investors judge whether the shift is sustainable:
- Earnings: Are profits growing through business expansion or only because of a favourable base?
- Valuation: Does expected growth justify the premium being paid?
- Cash flow: Are reported profits converting into operating cash?
- Balance sheet: Can the company manage debt if demand or liquidity weakens?
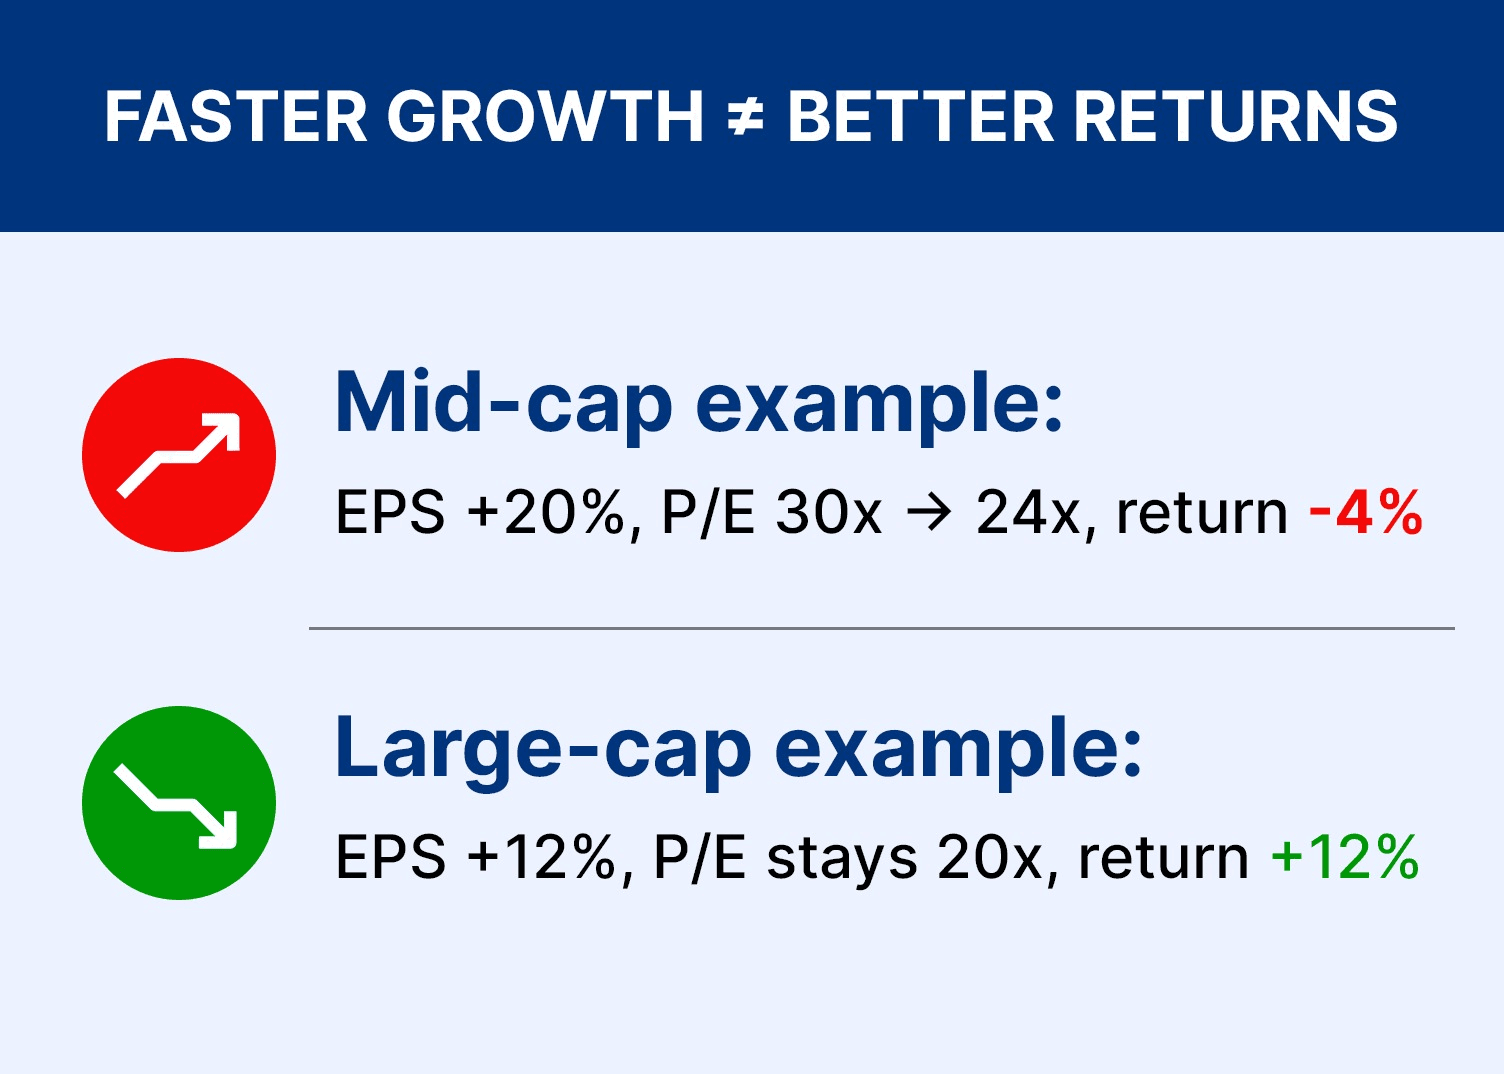
Consider two hypothetical companies. A mid-cap company earns ?10 per share and trades at 30 times earnings, giving it a price of ?300. If earnings grow by 20%, its EPS becomes ?12.
A large-cap company also earns ?10 per share but trades at 20 times earnings, giving it a price of ?200. With 12% growth, its EPS becomes ?11.20.
The mid-cap company deserves some premium because it is growing faster. However, suppose its valuation falls from 30 to 24 times earnings. Its price after one year would be ?288, despite the 20% earnings increase. The investor would lose 4%.
If the large-cap valuation remains at 20 times, its price would rise to ?224, producing a 12% gain. The example shows why earnings growth matters, but the price paid for that growth matters just as much.
What Could Make Large Caps Stage a Comeback?
A comeback does not need a dramatic economic event. It could begin if one or more identifiable triggers emerge:
- Large-cap earnings estimates stop falling and begin to improve.
- Foreign portfolio flows return to Indian equities.
- Higher crude prices or global uncertainty increase demand for liquid, established businesses.
- Mid-cap and small-cap earnings fail to justify elevated valuations.
- Investors rebalance portfolios after a long period of broader-market outperformance.
Foreign investors returned with approximately $3.1 billion of equity purchases in August, although they remained net sellers for 2026 overall. This illustrates how quickly one part of the flow picture can change.
What Should Investors Track From Here?
Instead of predicting the next winning category, investors can review this simple dashboard every quarter:
Indicator | What to monitor | Why it matters |
| Relative returns | Large-cap return minus mid/small-cap return | Shows whether leadership is changing |
| Earnings revisions | Upgrades versus downgrades | Tests whether prices have fundamental support |
| P/E premium | Mid/small-cap P/E relative to large caps | Reveals how much optimism is priced in |
| Fund flows | FPI and mutual fund category flows | Highlights liquidity support |
| Market breadth | Number of advancing versus declining stocks | Shows whether gains are broad or concentrated |
| Cash conversion | Operating cash flow versus reported profit | Helps identify weaker-quality growth |
For most long-term investors, the practical response is portfolio rebalancing rather than performance chasing. Market-cap segments behave differently across cycles. Holding an appropriate mix can reduce dependence on one market trend.
Instead of chasing the latest outperforming category, investors should focus on valuation, earnings quality, and portfolio diversification. Explore Grip Invest to discover carefully evaluated investment opportunities that can help you diversify beyond conventional market choices.
All investments carry risk. Review the relevant documents and assess their suitability before investing.
FAQs On Large-Cap Funds Underperforming
Want to stay at the top of your finances?
Join the community of 4 lakh+ investors and learn more about Grip Invest, the latest financial knick-knacks, and shenanigans in the world of investing.
Happy Investing!
Disclaimer - Investments in debt securities/municipal debt securities/securitised debt instruments are subject to risks, including delay and/ or default in payment. Read all the offer-related documents carefully. The investor is requested to take into consideration all the risk factors before the commencement of trading.
This communication is prepared by Grip Broking Private Limited (bearing SEBI Registration No. INZ000312836 and NSE ID 90319) and/or its affiliate/ group company(ies) (together referred to as “Grip”) and the contents of this disclaimer are applicable to this document and any and all written or oral communication(s) made by Grip or its directors, employees, associates, representatives and agents. This communication does not constitute advice relating to investing or otherwise dealing in securities and is not an offer or solicitation for the purchase or sale of any securities. Grip does not guarantee or assure any return on investments and accepts no liability for the consequences of any actions taken based on the information provided. For more details, please visit www.gripinvest.in
Registered Address - 106, II F, New Asiatic Building, H Block, Connaught Place, New Delhi 110001


