
EV/EBITDA Ratio Explained: Formula, Meaning And Comparison With P/E


When conducting financial analysis for a company, assessing financial statements can at times provide incomplete information about the enterprise's performance and position.
For better company analysis, historical financial assessment, and to carry out comparative analysis between two or more companies, using financial ratios provides a better picture to the investors and other users of financial information.
One such ratio is the EV/EBITDA Ratio, which is quite popular among analysts for assessing the financial performance of companies, including listed enterprises.
This ratio compares a company’s total value to its operating profitability, giving investors a clearer picture of how a business is priced relative to its earnings.
It is a bit different from the conventional ratios, which focus largely on the equity part.
This ratio is more comprehensive as it considers other elements such as debt and cash.
This is why, when comparing companies across different sectors where capital structures differ, this ratio can be indispensable.
What Is Enterprise Value (EV)?
EV = Market Cap + Debt - Cash
EV or Enterprise Value depicts the total value of the company, which is calculated by adding market capitalization and debt and subtracting cash (and equivalents). Hence, the value of the company is determined by taking into account both equity and debt. This approach also ensures that cash is factored in, which can reduce the effective acquisition cost.
Why EV Matters?
Enterprise Value can be considered a more realistic estimate of the cost to acquire a business. EV considers obligations such as debt, thereby being a better metric than market capitalization.
This is particularly helpful when considering companies with different capital structures. For example, two companies with similar market caps may have vastly different debt levels, which impacts their true valuation.
What Is EBITDA?
EBITDA is an acronym for Earnings Before Interest, Taxes, Depreciation, and Amortization. It is often part of a company's income statement and depicts its operating performance while excluding non-operating and accounting-related expenses.
When understanding the EV EBITDA meaning, think of EBITDA as a proxy for cash earnings generated by core operations. It eliminates the distortions that are caused by financial decisions and accounting policies, thereby ensuring that investors can compare profits more objectively.
EV/EBITDA Formula And Calculation With Example
Formula:
The EV EBITDA formula is as follows:
EV/EBITDA = Enterprise Value ÷ EBITDA
Example Calculation:
Let us consider an example of ABC Limited, having a total market capitalization of INR 10,000 crore. The debt of the company is INR 2000 crore and the available cash and equivalents is INR 500 crore. The EBITDA as per the financial statement is INR 1500 crore.
The first step will be to calculate the EV.
EV = 10,000 + 2,000 - 500 = INR 11,500 crore
Based on that, the ratio shall be:
EV/EBITDA = 11,500 ÷ 1,500 = 7.67x
This implies that the company is valued 7.67 times its operating earnings. If the ratio is too low, it might indicate an undervalued company. On the other hand, if the ratio is too high, it might indicate premium pricing or overvaluation.

What Is A Good EV/EBITDA By Sector In India?
A ‘good’ or ‘ideal’ EV/EBITDA is quite difficult to ascertain, as the external environment for every sector is quite dynamic. The ratios that were relevant a couple of years ago have completely changed in 2026.
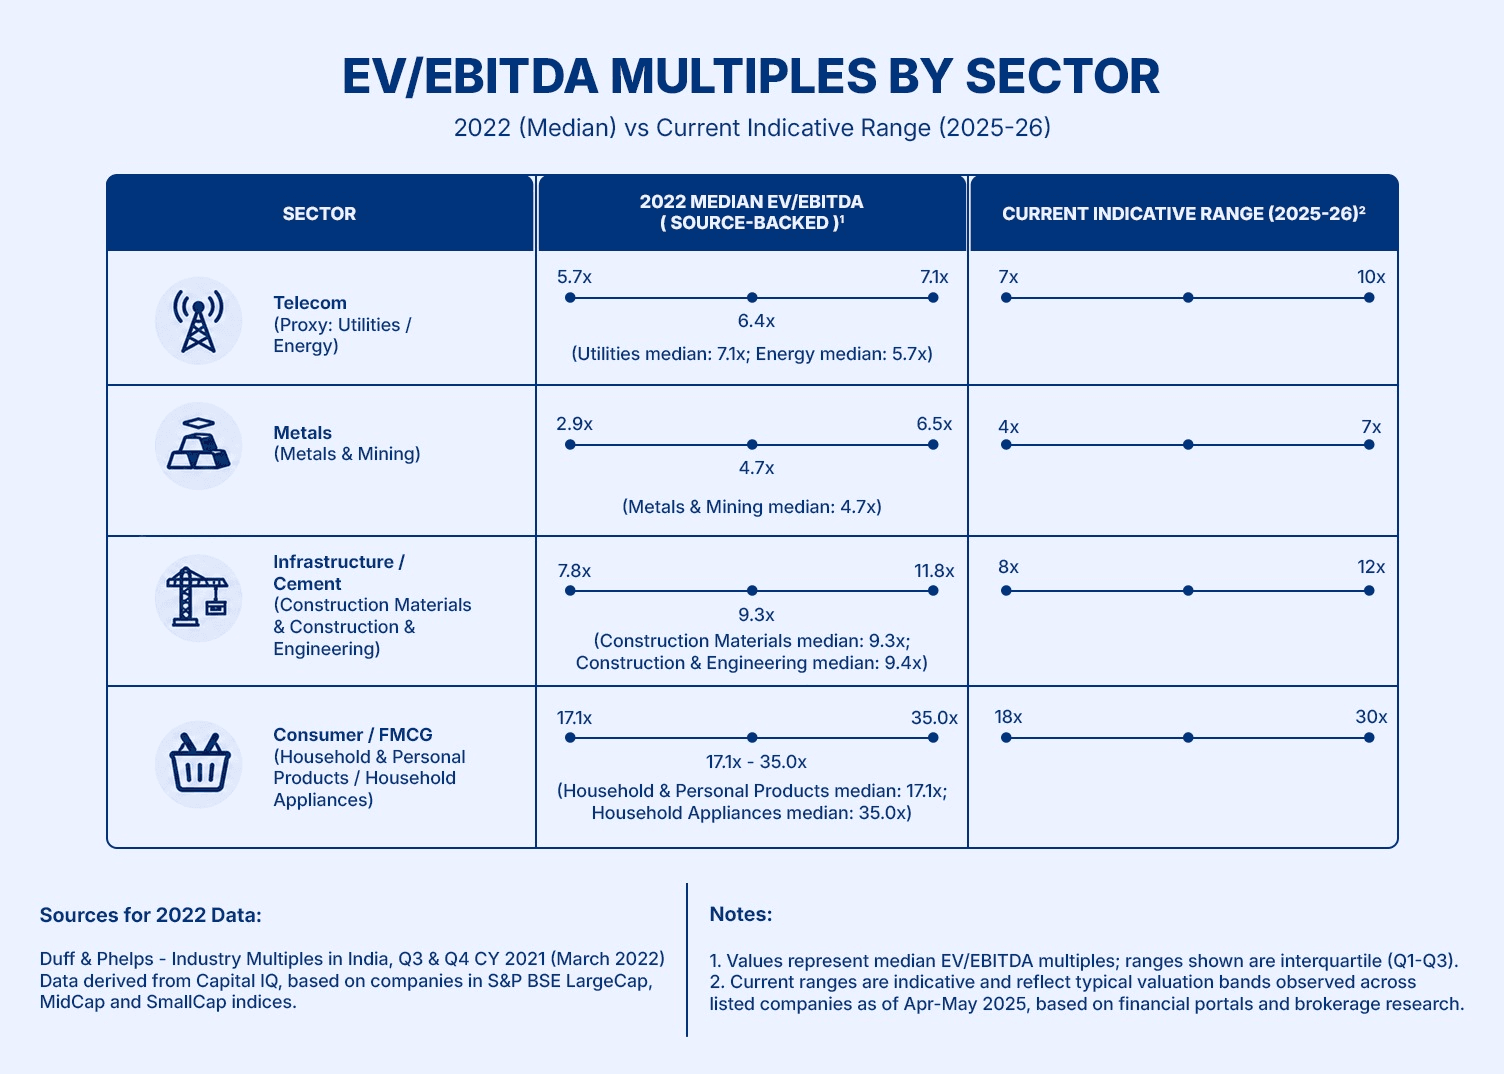
However, from a general perspective, it is worth noting that capital-intensive sectors, including infrastructure and telecom, typically trade at lower multiples due to high debt and slower growth.
In contrast, consumer and technology-driven businesses often command higher valuations.
Here is how ‘good’ or median EV/EBITDA ratios have fared in India (sector-wise):
EV/EBITDA vs P/E vs P/B: A Practical Comparison Table
When evaluating EV EBITDA vs PE ratio along with P/B ratio, it is important to consider that each ratio has a distinct use case.
Here is the scope and application of each ratio summarized in the table:
Metric | What It Measures | Best Use Case | Limitation |
EV/EBITDA | Total firm value vs operating earnings | Comparing firms with different debt levels | Ignores capital expenditure |
P/E Ratio | Price vs net earnings | Equity investor perspective | Distorted by debt and accounting |
P/B Ratio | Market value vs book value | Asset-heavy sectors like banks | Less useful for high-growth firms |
The reason for the popularity and preference for the EV/EBITDA ratio is that it eliminates the effects of capital structure and accounting differences, making cross-company comparison feasible.
Conclusion
The popularity of the EV/EBITDA ratio in financial ratio analysis stems from its greater comprehensiveness than conventional, equity-centered ratios. The valuation is complete when it is correlated with operating performance and is critical for businesses with varying debt levels.
However, it is always better to use multiple metrics to ensure the financial analysis is comprehensive and provides better input for decision-making.
FAQs On EV/EBITDA Ratio
Author: Grip Invest Editorial Team The Grip Invest Editorial Team is a group of Chartered Accountants, MBA (Finance) graduates, and Qualified Research Analysts dedicated to helping you invest smarter. We dive deep into India's fixed income landscape to deliver content that is accurate, up-to-date, and easy to understand. Whether you're exploring bonds, fixed deposits, or other fixed income opportunities, our guides cut through the noise and give you the clarity to make better financial decisions. |
Want to stay at the top of your finances?
Join the community of 4 lakh+ investors and learn more about Grip Invest, the latest financial knick-knacks, and shenanigans in the world of investing.
Happy Investing!
Disclaimer - Investments in debt securities/municipal debt securities/securitised debt instruments are subject to risks including delay and/ or default in payment. Read all the offer related documents carefully. The investor is requested to take into consideration all the risk factors before the commencement of trading.
This communication is prepared by Grip Broking Private Limited (bearing SEBI Registration No. INZ000312836 and NSE ID 90319) and/or its affiliate/ group company(ies) (together referred to as “Grip”) and the contents of this disclaimer are applicable to this document and any and all written or oral communication(s) made by Grip or its directors, employees, associates, representatives and agents. This communication does not constitute advice relating to investing or otherwise dealing in securities and is not an offer or solicitation for the purchase or sale of any securities. Grip does not guarantee or assure any return on investments and accepts no liability for consequences of any actions taken based on the information provided. For more details, please visit www.gripinvest.in
Registered Address - 106, II F, New Asiatic Building, H Block, Connaught Place, New Delhi 110001


