

Gold Price During War: How Gold Has Performed In Major Conflicts Across History


Escalated geopolitical tensions during military conflicts and wars create a period of market instability, as investments like stocks and currencies witness downturns. In such a scenario, gold acts as a safe-haven asset for capital preservation and appreciation.
This blog decodes gold during war history, through a nuanced analysis of gold price movements and market reactions during conflict periods. From the gold price in World Wars to the Gulf War, this historic deep dive is instrumental in understanding the role of gold as a safe-haven asset.
Gold Price During The 2026 Iran War (Ongoing)
Gold's reaction to the US-Israel-Iran conflict has been anything but linear. After hitting an all-time high of $5,300+ per ounce and INR 1,69,349 per 10g on 2 March 2026, gold has since reversed sharply, marking its biggest weekly drop since 1983.
Here is how gold has moved through the conflict:
| Period | Gold Price (USD/oz) | India Price (INR/10g) |
| January 2026 (pre-war) | ~$2,900 | ~INR1,30,000 |
| 28 Feb 2026 (war begins) | ~$3,100+ | ~INR1,40,000+ |
| 2 March 2026 (ATH) | ~$5,300+ | INR1,69,349 |
| Mid-March 2026 (correction) | ~$4,800+ | ~INR1,56,000 |
| 23 March 2026 (latest) | ~$4,404 | ~INR1,38,686 |
Why Did Gold Fall Despite The War Continuing?
The same conflict that initially drove gold up is now pulling it down and the reason is inflation:
- Surging oil prices due to Strait of Hormuz disruptions have raised global inflationary risks significantly
- Higher inflation has reduced the probability of near-term interest rate cuts by the US Fed and other central banks
- Since gold is a non-yielding asset, rising interest rate expectations make it less attractive compared to bonds and dollar-denominated instruments
- Gold fell for eight consecutive sessions through the week of March 23, as markets repriced the macro environment
- Bullion briefly plunged to near $4,320, almost wiping out all of 2026's gains
What does this mean for investors?
Gold's sharp correction is a reminder that even safe-haven assets are not immune to macro forces. Despite the fall, gold is still around 46% higher than a year ago. J.P. Morgan predicts gold could reach $6,300 per ounce by end of 2026 if the conflict prolongs and inflation expectations eventually cool.
For Indian investors, the rupee depreciation continues to act as a partial cushion, keeping domestic gold prices elevated relative to global dollar-denominated moves.
The current dip may represent a tactical entry point for long-term investors, but short-term volatility is expected to remain high as long as the geopolitical situation remains unresolved.
Gold Price During World War I (1914–1918)
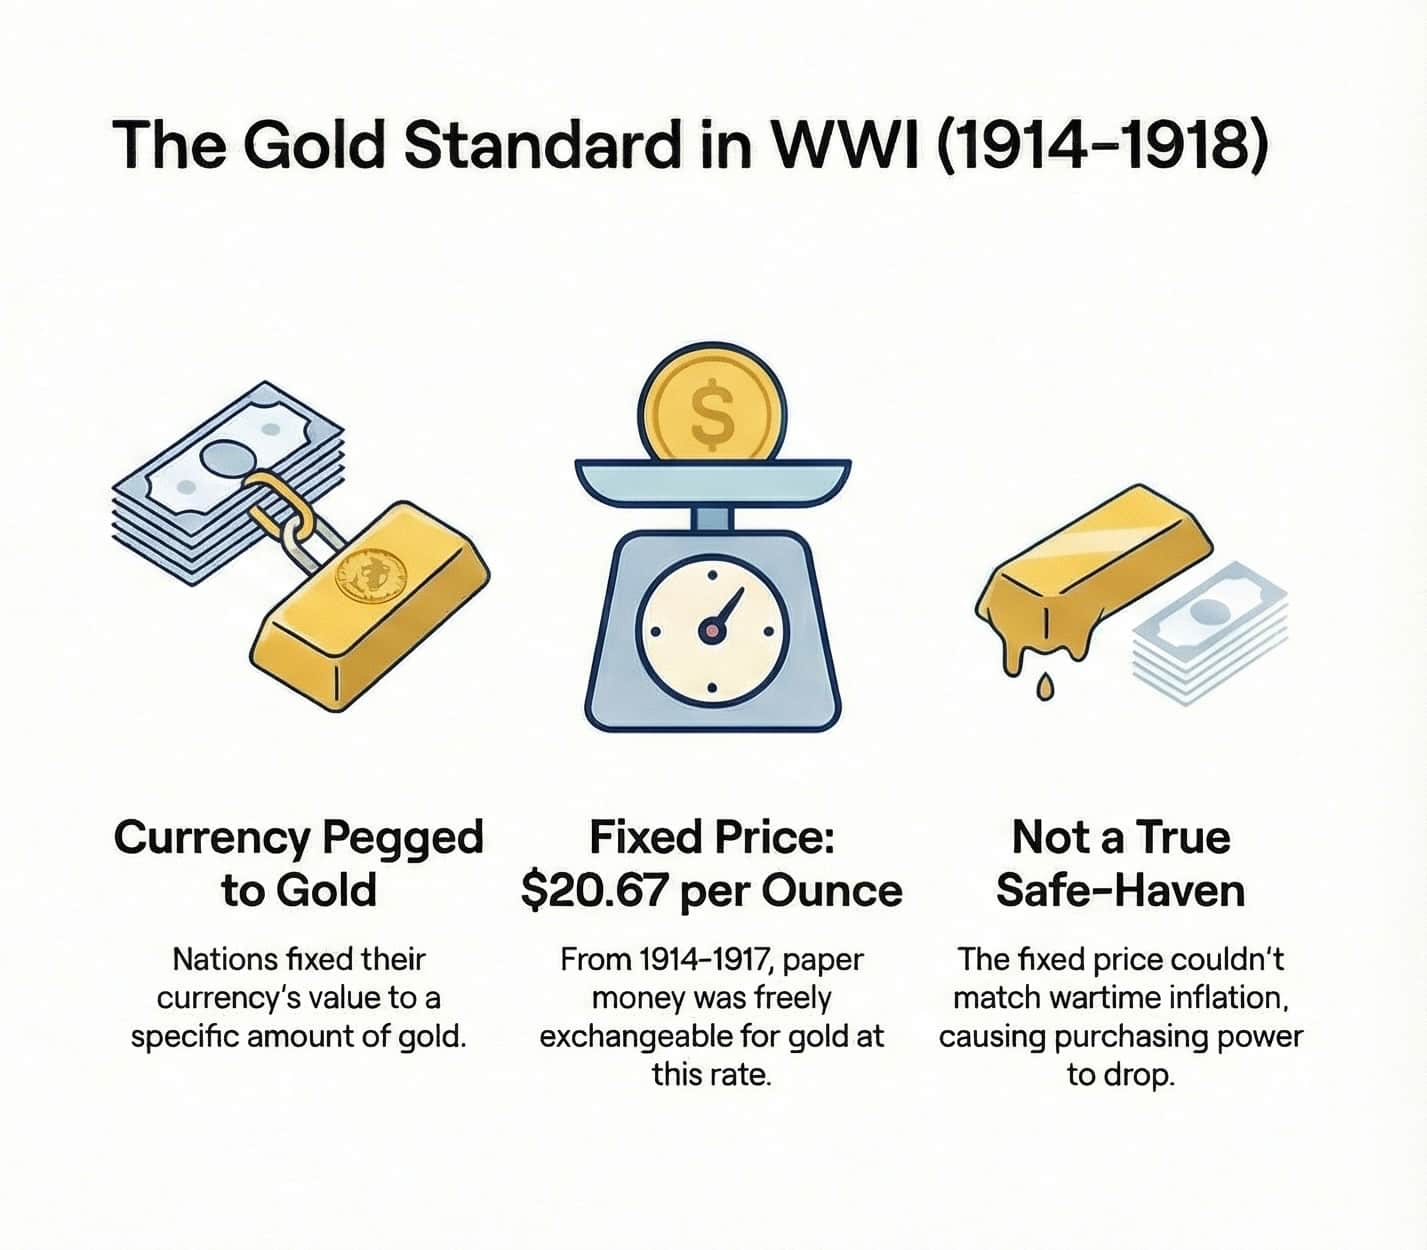
During World War I, the world followed the Gold Standard, a system no longer in use. Under this system, gold prices were standardised, meaning the currency of each nation was pegged against a certain amount of gold. The paper currency was freely convertible, allowing people to exchange paper money for gold at a fixed rate. This resulted in fixed gold prices, irrespective of market forces.
For instance, from 1914-17, the gold price was fixed at USD 20.67 per ounce1,2. Moreover, people could exchange USD 20.67 for 1 ounce of physical gold.
When World War I broke out in 1914, some countries suspended gold convertibility so that they could print more money, against the existing gold reserves, to meet war expenses with a promise of restoring the pre-war standard post victory. This had severe consequences.
1. Differing Gold Reactions: For countries that remained neutral (like the 1914-17 US), the official gold price remained stable. However, prices surged in other places, resulting in a fall in gold value in real terms.
2. Not a Safe-Haven: The fixed price failed to match inflation in many regions, leading to a drop in purchasing power.
However, gold retained utility for liquidity and international payments. For example, the Allies, especially Great Britain, used gold reserves to buy US supplies.
Gold Price During World War II (1939–1945)
Post World War I, the negative impact of the fixed gold price during the war made way for new mechanisms by several countries. As the classical Gold Standard system failed, several countries left the system, starting with Japan and Great Britain in 19313. In 1934, the US restored a fixed gold rate at USD 35 per ounce in January 1934, while limiting its citizens from owning gold.
Therefore, even during World War II, gold was heavily controlled by the governments, restricting free market retail investments. While retail price impacts were limited, at an international level, countries could be seen benefiting from its inherent nature as a safe-haven asset.
- By 1947, the United States had accumulated 70% of global gold reserves, while the UK had gone from the largest global debtor to the largest global creditor4. This solidified the place of the US as a Superpower post-war.
- Gold functioned as a reserve and settlement asset between central banks. It enabled wealth preservation and cross-border transactions despite official controls.
The restrictive practice of gold price in world wars gradually paved the way for free market mechanisms that allowed retail investors to secure a hedge in gold.
Gold During The Vietnam War Era (1955–1975)
The Vietnam War solidified the end of the fixed gold rate. In 1968, the demand for gold surged extensively, fueled by the fear of war. The annual average gold price that previously remained fixed at USD 35 or USD 35.31 surged to USD 40.20 in 19685.
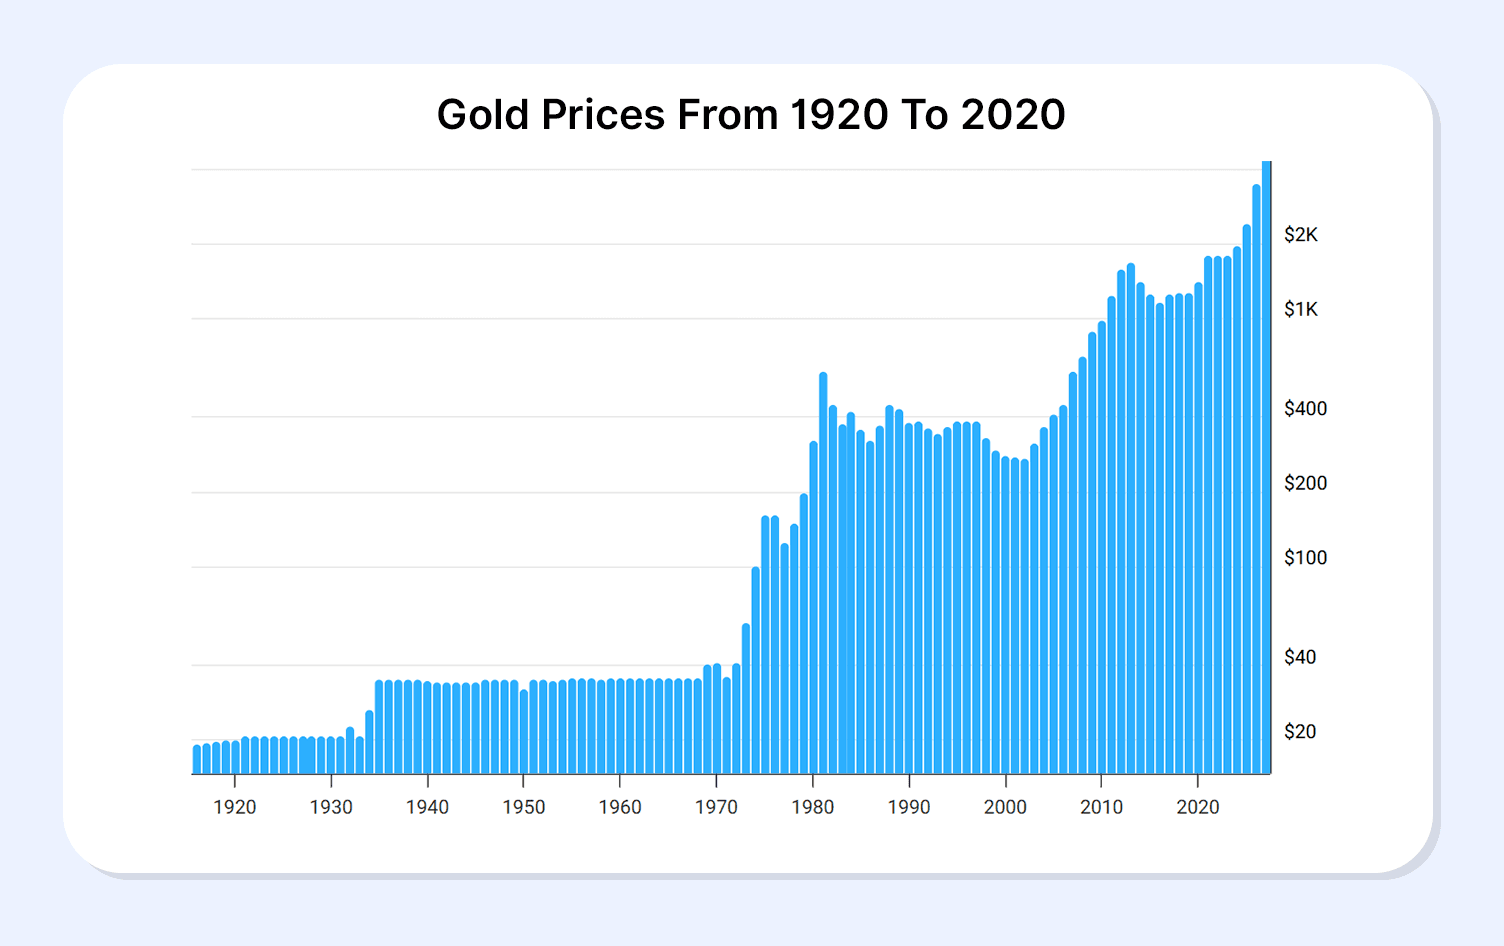
Then, in 1971, came the Nixon Shock, when President Nixon unilaterally ended the convertibility of the US dollar into gold. With no fixed price, the gold price could rise with market demand. Therefore, investment in gold could help capital preservation and appreciation as investors lost faith in market assets and currency value. From USD 35.31 in 1960, the annual average gold price reached USD 196.80 in 1978, ultimately hitting USD 607.76 in 1980.
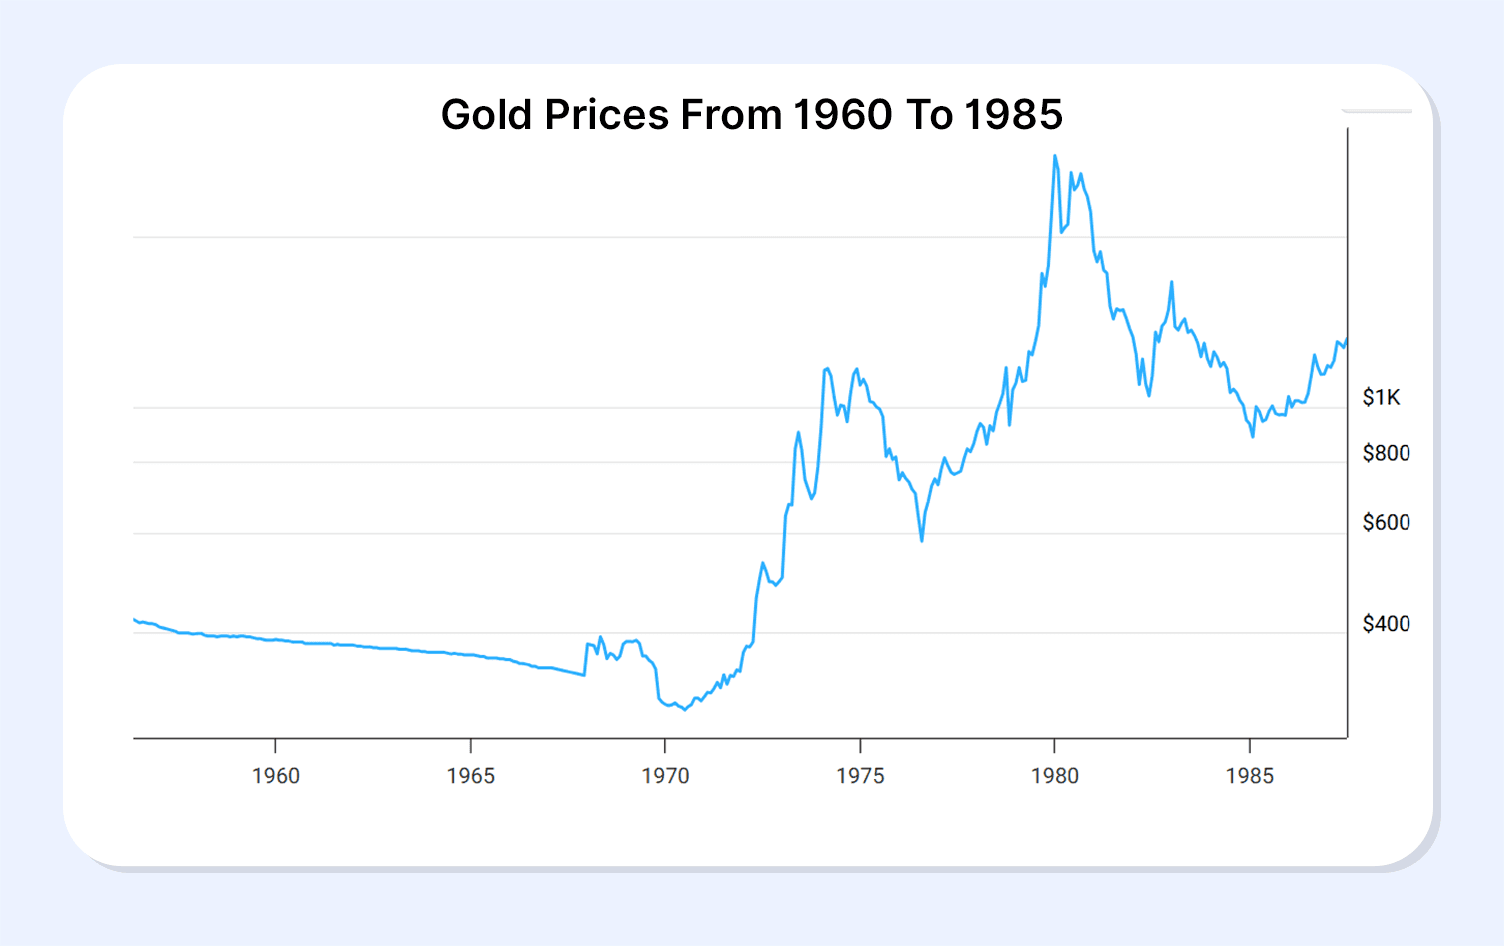
The gold as safe-haven history that began in this era continued with gold offering refuge to investors during conflicts and market instability.
Gold Price During The Gulf War (1990–1991)
During the Gulf War, as Iraq invaded Kuwait, both gold and silver emerged as safe-haven assets6. The price of gold surged from USD 384 per ounce in July 1990 to USD 403 per ounce in August 1990.
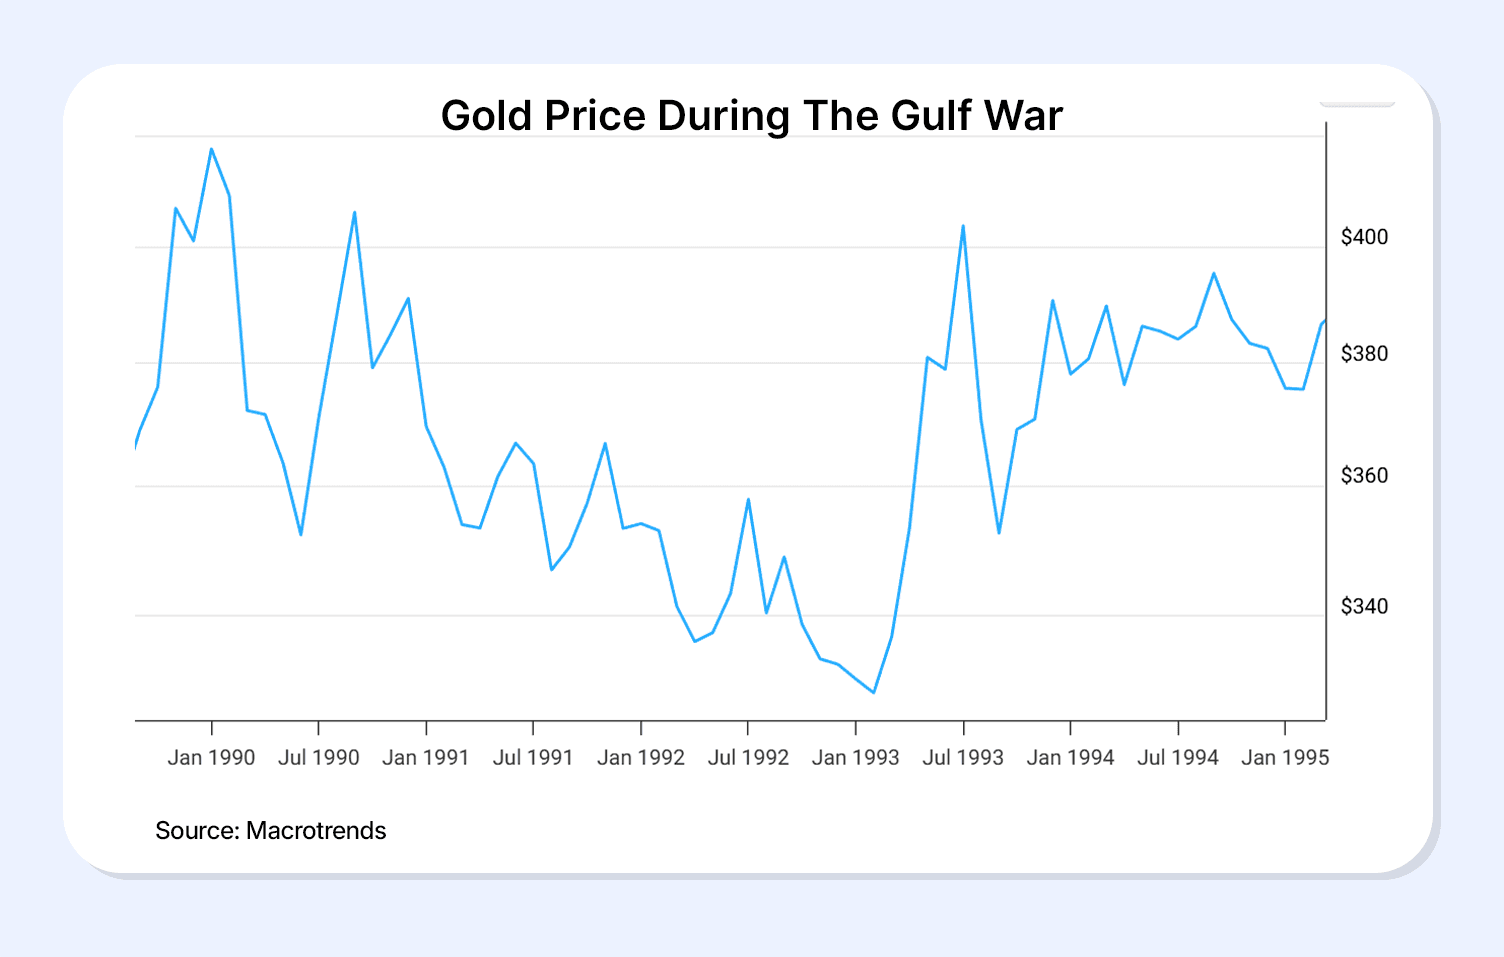
The Gulf War ended quickly, and with Operation Desert Storm, the prices soon levelled out. Although prices fell post-conflict, during the war, gold aided in capital preservation and appreciation.
Gold During Prolonged Global Tensions (Cold War Period)
The history of gold price conflict periods cements the role of gold as a safe-haven asset. The major conflicts of modern history that posed uncertainty among the masses saw an upsurge in gold rates and demand. The graph below illustrates how the gold surge coincides with key conflicts.
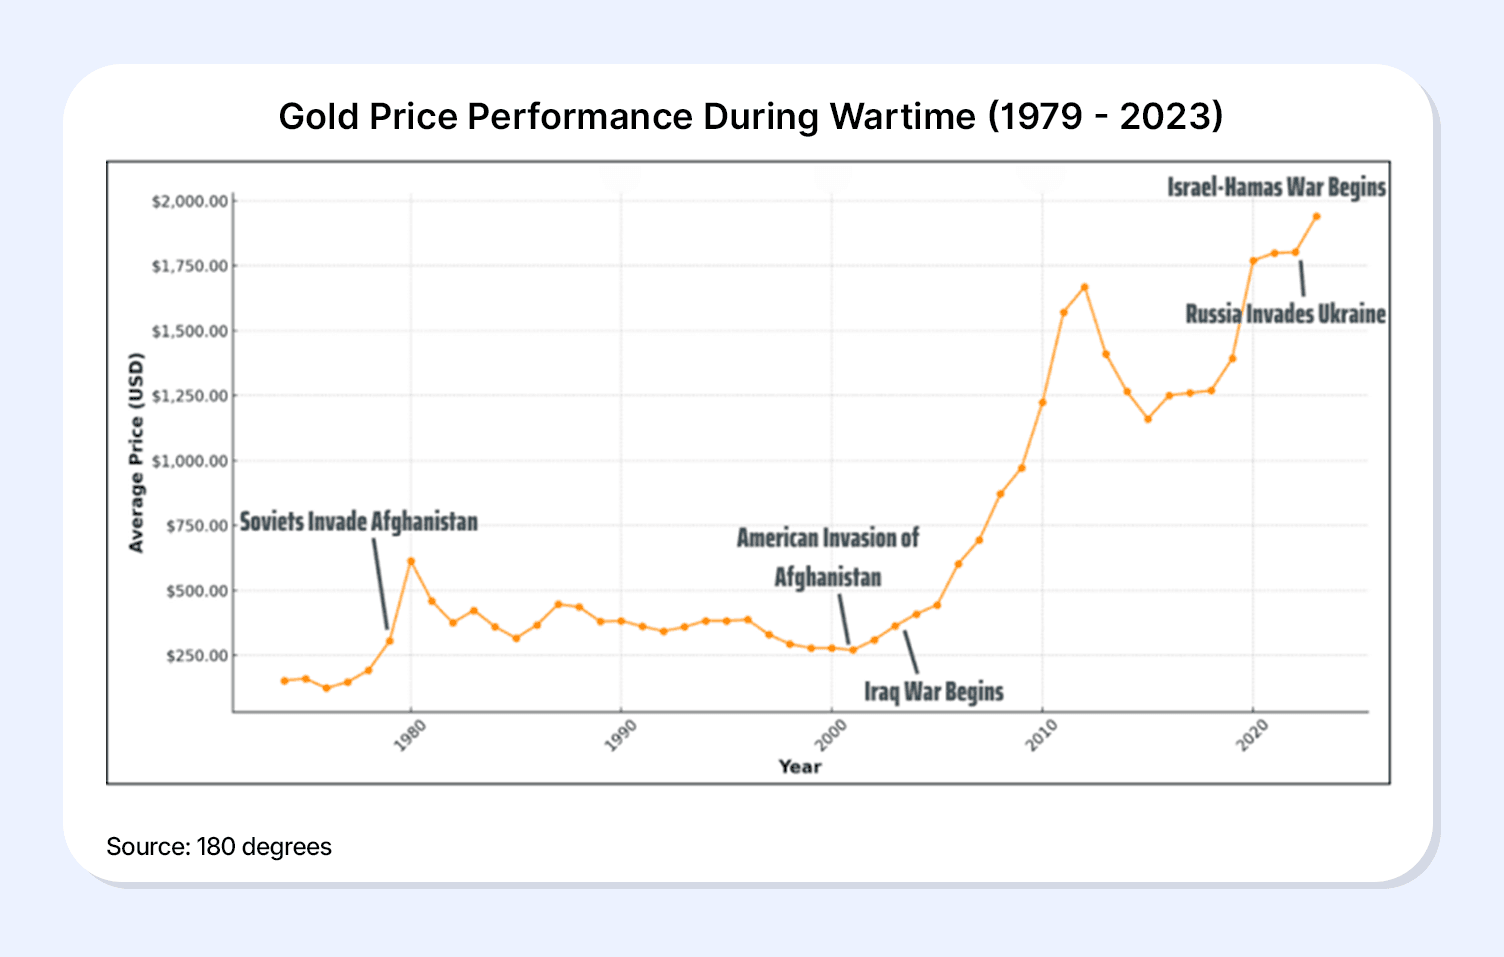
Even in the case of long-drawn tensions, gold has often provided refuge to investors. For instance, in the case of the Cold War, which lasted about 45 years, gold saw several peaks9. Although volatility persisted as several major events occurred during the long span, the peaks provided opportunities for gains.
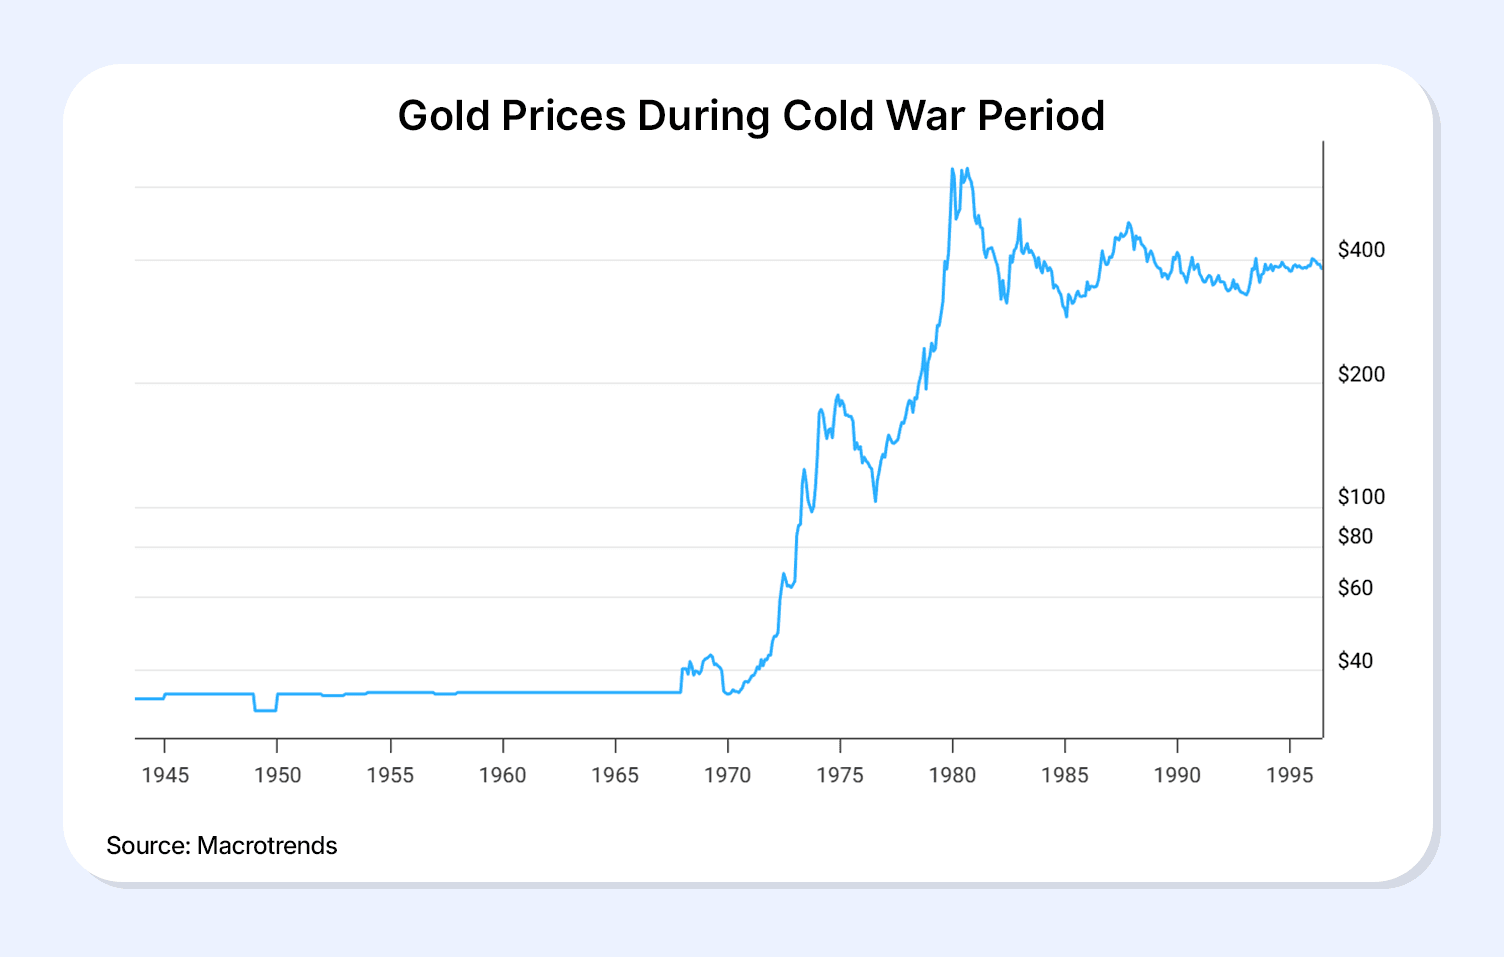
This detailed history of the gold price during wars and tensions delivers keen highlights that can help inform investing.
Key Patterns From Gold’s Performance During Wars
Gold acts as a haven during conflicts. However, the nature of conflicts creates its unique gold price pattern. In other words, the impact of the gold price varies with the nature of tension.
Discussed below are some key takeaways.
1. Short vs Long War Impact: Short-lived conflicts, like the Gulf War, often produce modest, temporary gold price spikes that fade relatively quickly once the immediate crisis passes. Globally impactful conflicts that persist for long often cause sustained and exponential gold rallies.
2. Inflation vs Fear-Driven Rallies: A sudden outbreak of hostilities can result in immediate market reactions as investors search for safety. However, a gold price surge that happens due to inflation develops gradually and sustains for a long time. For instance, the long-drawn Cold War witnessed peaks stemming from sudden conflicts, while there was an overall rise in price level due to inflation.
Conclusion
Gold’s performance across major wars and prolonged geopolitical tensions makes one thing clear: uncertainty repeatedly pushes investors toward assets that can preserve value when traditional markets struggle.
From tightly controlled gold prices during the World Wars to freely traded, inflation-driven rallies after the end of the Gold Standard, gold has consistently played the role of a financial refuge.
However, its returns vary depending on the duration and nature of the conflict, which is why relying on a single asset is rarely enough. A balanced approach that combines gold with stable, income-generating instruments can help investors navigate uncertain phases more effectively.
Platforms like Grip Invest enable this diversification by offering access to regulated bonds and high-yield fixed deposits, allowing investors to complement gold exposure with predictable returns and build resilience into their portfolios during volatile times.
FAQs
1. How has gold historically performed during wars?
Historically, gold has acted as a safe-haven asset offering capital appreciation and preservation. The gold rate showed surges during key tensions, post-removal of fixed gold rates.
2. Did gold prices always rise during conflicts?
Yes, post-removal of fixed gold rates, gold prices have recorded surges and rallies during key conflict situations.
3. Why did gold surge after the Vietnam War but not during World War II?
During World War II, the gold price was heavily controlled by the government. Gold was convertible at fixed rates, limiting any surge from market demand. This was not the case during the Vietnam War, resulting in a surge.
4. Is gold better than bonds during wartime uncertainty?
During uncertainty, prioritisation of diversification across safe-haven assets like gold and fixed-income securities like bonds can offer optimal portfolio stability. Dependence on one asset category can increase the risk profile of a portfolio.
5. Why does gold price increase during war?
Gold prices rise during wars because conflict creates economic and financial uncertainty. Stock markets fall, currencies weaken, and the future becomes unpredictable. In such times, investors move their money into assets that hold value regardless of what happens to governments or economies. Gold fits this role perfectly because:
- It has no counterparty risk — its value doesn't depend on any government's promise
- It acts as a hedge against inflation, which typically spikes during wartime due to heavy government spending
- It is universally accepted — it can be liquidated or used for international settlements anywhere in the world
- When currencies lose trust (as seen after Nixon ended the Gold Standard in 1971), gold becomes the default store of value
6. Does gold price always increase during war?
Not always, it depends on how gold was priced at the time and how long the conflict lasts.
- During World War I and II, gold prices were government-controlled under the Gold Standard, so retail investors saw little to no price gains despite global chaos
- During short conflicts like the Gulf War (1990-91), gold saw a sharp but temporary spike that faded quickly once the war ended
- During prolonged or globally impactful conflicts like the Vietnam War era, the Cold War, and now the 2026 Iran War , gold has delivered sustained, significant gains
The modern takeaway: in today's free-market environment, where gold trades without government price controls, any major conflict tends to push gold prices higher at least in the short to medium term.
The bigger and more uncertain the conflict, the stronger and longer the gold rally.
References:
1. Only gold, accessed from: https://shorturl.at/4t63s
2. Cato institute, accessed from: https://shorturl.at/SWXu4
3. Britannica, accessed from: https://www.britannica.com/money/money/The-decline-of-gold
4. IMF, accessed from: https://www.imf.org/external/np/exr/center/mm/eng/mm_dr_01.htm
5. Macrotrends, accessed from: https://www.macrotrends.net/1333/historical-gold-prices-100-year-chart
6. Coinbazaar, accessed from: https://coinbazaar.in/blog/middle-east-conflict-timeline-and-its-historical-impact-on-gold-silver-rates/
7. Macrotrends, accessed from: https://www.macrotrends.net/1333/historical-gold-prices-100-year-chart
9. 180 degree, accessed from: https://180dcsrcc.in/when-oil-burns-gold-glitters-how-the-israel-iran-conflict-is-shaping-global-gold-markets/
10. Norwich, accessed from: https://online.norwich.edu/online/about/resource-library/5-key-cold-war-events
11. Macrotrends, accessed from: https://www.macrotrends.net/1333/historical-gold-prices-100-year-chart
Want to stay at the top of your finances?
Join the community of 4 lakh+ investors and learn more about Grip Invest, the latest financial knick-knacks, and shenanigans in the world of investing.
Happy Investing!
Disclaimer - Investments in debt securities are subject to risks. Read all the offer-related documents carefully. The investor is requested to take into consideration all the risk factors before the commencement of trading. This communication is prepared by Grip Broking Private Limited (bearing SEBI Registration No. INZ000312836 and NSE ID 90319) and/or its affiliate/ group company(ies) (together referred to as “Grip Invest”) and the contents of this disclaimer are applicable to this document and any and all written or oral communication(s) made by Grip Invest or its directors, employees, associates, representatives and agents. This communication does not constitute advice relating to investing or otherwise dealing in securities and is not an offer or solicitation for the purchase or sale of any securities. Grip Invest does not guarantee or assure any return on investments and accepts no liability for the consequences of any actions taken based on the information provided. For more details, please visit https://www.gripinvest.in/.
Registered Address - 106, II F, New Asiatic Building, H Block, Connaught Place, New Delhi 110001.


