

How To Read A Mutual Fund Factsheet In 2026: A Simple Guide For Investors



A mutual fund factsheet is one of the most basic fund information documents investors can use to understand a fund's portfolio, performance, risk and costs. However, the information in a factsheet can seem complex at first.
Understanding how to read a mutual fund factsheet can help investors move beyond simply analysing past returns. A factsheet can show scheme ownership, how assets are used, performance against its benchmark and the risks and costs involved.
These disclosures remain useful for monitoring a scheme in 2026, with portfolio information updated monthly. SEBI requires mutual fund portfolios to be disclosed on the last day of the month, within 10 calendar days, and the Risk-o-meter to be evaluated and disclosed in the portfolio each month.
In this guide, we explain how to read a mutual fund factsheet and what investors should check before investing in a scheme.
What Is A Mutual Fund Factsheet?
A mutual fund factsheet is a periodic statement issued by an Asset Management Company. It contains key information about a mutual fund scheme. It typically includes the scheme's investment objective, the fund manager, the benchmark, assets under management, net asset value, portfolio holdings, asset allocation, performance, risk measures and expenses.
According to AMFI, a fund factsheet summarises a scheme, highlighting portfolio and scheme performance, and is regularly published by mutual funds.
For an investor, a mutual fund factsheet is a snapshot of how the fund is doing at a specific point in time.
However, it does not promise future profits. Mutual fund values may fluctuate with the values of the securities in the mutual fund, and past performance is not a guarantee of future performance.
Start With The Fund's Basic Details
When analysing a mutual fund factsheet, start by understanding the basic details of the scheme.
Start with:
1. Scheme Name and type: Determine if it is equity, debt, hybrid, index, solution-oriented or another type.
2. Investment objective: Check what the fund aims to achieve and the types of securities it can invest in.
3. Benchmark: A standard to compare performance against.
4. Fund manager: Make note of who the fund is managed by and, if provided, their experience.
5. AUM (Assets under management): A measure of the scheme's size as of the calculation date.
6. NAV: The net asset value is the value of the scheme's net assets per unit.
7. Plan: Determine if you have a direct plan or a regular plan.
For example, a hypothetical equity fund may aim to invest primarily in large-cap stocks. Assess it in that context rather than comparing it with a small-cap or debt fund.
How To Read The Portfolio Section
The heart of any mutual fund portfolio factsheet is the portfolio section, which shows how the scheme invests the money.
Understanding Portfolio Holdings
First, review the top holdings and the percentage of the portfolio they represent. Second, review the sector or asset allocation to see whether investments are diversified across a variety of companies, industries or securities, depending on the fund type.
Checking Portfolio Changes
The portfolio is a historical record and should always be read alongside the reporting date, as holdings may change over time. Make sure to review the latest factsheet and compare it with previous disclosures to identify any significant differences in holdings, sector exposure or asset allocation. For debt funds, check credit ratings to understand the portfolio's credit quality, and maturity and duration to assess its interest-rate sensitivity.
Consider a hypothetical equity fund with the following allocation:
Portfolio component | Allocation |
Top 10 stocks | 48% of portfolio |
Financial Services | 24% of portfolio |
Information Technology | 15% of portfolio |
Healthcare | 10% of portfolio |
Cash And Others | 3% of portfolio |
These numbers can show that the portfolio has significant weight in its largest sectors and holdings. However, do not use these numbers in isolation; consider them alongside the fund's investment objective and category.
Also, check the portfolio date. A factsheet is a snapshot rather than a “live” portfolio, so holdings may have changed since the reporting date.
How To Read Mutual Fund Performance Data
Typically, one of the most salient parts of a factsheet is performance; but beyond the highest return, mutual fund factsheet analysis requires a deeper look.
Look at various time periods like:
- 1 year
- 3 years
- 5 years
- Ever since its inception (if applicable)
Next, compare the scheme's performance with its benchmark for the same period.
For instance, consider a hypothetical fund with the following performance:
Period | Fund | Benchmark |
1 year | 11% | 10% |
3 years* | 12% | 11% |
5 years* | 13% | 12% |
*Illustrative annualised returns.
The comparison shows how the fund performed relative to the benchmark during this period. It does not indicate that the difference will continue.
For SIP investors, the fact sheet can display SIP-related performance data or SIP returns separately. Do not compare these values to lump-sum returns, as they are calculated differently.
How To Read Risk And Cost Information
The risk section helps investors understand the level and nature of risk associated with the scheme.
First, use the Risk-o-meter. As of 2026, the six risk levels are classified as low, low to moderate, moderate, moderately high, high and very high. The Risk-o-meter is assessed monthly and made public when the scheme portfolio is published.
Other factsheets may include information on measures such as:
- Standard deviation
- Beta
- Sharpe ratio
- Portfolio turnover
- Tracking error for passive funds
- Duration for debt funds
Context matters for these measures. For instance, standard deviation tends to be higher for funds with a more volatile history, and tracking error matters most when assessing how closely an index fund or ETF tracks its benchmark.
Next, check the total expense ratio (TER). TER represents the costs of running and managing the scheme, expressed as a percentage of its average NAV. These expenses are reflected in the scheme's NAV. AMC websites and AMFI's website disclose TER information daily.
For example, suppose two hypothetical funds have expense ratios of 1% and 0.50%. The difference in their expense ratios is 0.50 percentage points per year, without accounting for differences in underlying portfolio performance or other factors.
A 5-Minute Mutual Fund Factsheet Checklist
You do not need to analyse every number in a factsheet to get a useful overview of the scheme. Knowing how to read a mutual fund factsheet can make the process much easier.
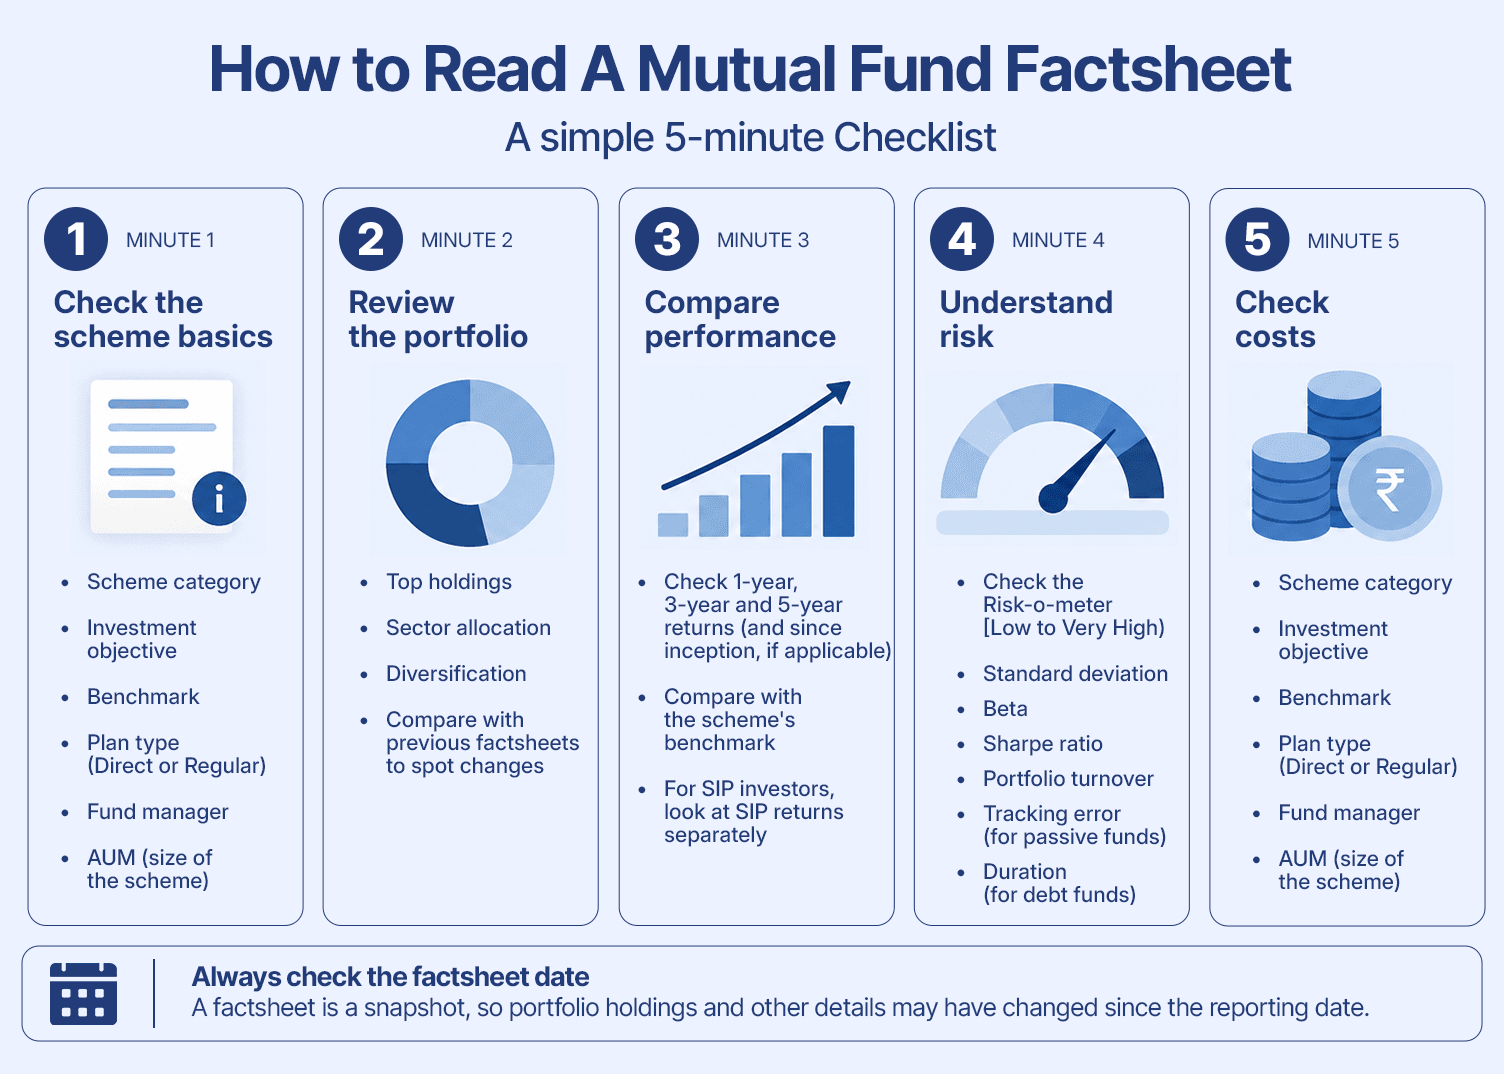
Minute 1: Check the scheme basics: Find out about its category, investment objective, benchmark and plan.
Minute 2: Review the portfolio: Review top holdings, sector allocation and diversification.
Minute 3: Review performance: Compare 1-year, 3-year and 5-year performance with the relevant benchmark, if applicable.
Minute 4: Check risk: Explore the Risk-o-meter and associated risk measures for the scheme category.
Minute 5: Review costs: Review TER and understand whether you are reviewing a Direct Plan or a Regular Plan.
Lastly, check the date on the factsheet. The date tells you the period the information relates to, which is important when assessing how current the portfolio and other details are. Investors can access up-to-date scheme details on their AMC's website and on AMFI's website. AMFI also provides current and historical NAV data.
Conclusion
Reading a mutual fund factsheet is not difficult. Investors can better understand a scheme by reviewing its objective, portfolio, performance, risk and costs. Consider what the fund invests in, its returns, how they compare with the fund's benchmark, and whether the fund's risk and costs meet your expectations. Check the factsheet regularly to see how the portfolio evolves.
FAQs

Want to stay at the top of your finances?
Join the community of 22 lakh+ investors and learn more about Grip Invest, the latest financial knick-knacks, and shenanigans in the world of investing.
Happy Investing!
Disclaimer - Investments in debt securities/municipal debt securities/securitised debt instruments are subject to risks including delay and/ or default in payment. Read all the offer related documents carefully. The investor is requested to take into consideration all the risk factors before the commencement of trading.
This communication is prepared by Grip Broking Private Limited (bearing SEBI Registration No. INZ000312836 and NSE ID 90319) and/or its affiliate/ group company(ies) (together referred to as “Grip”) and the contents of this disclaimer are applicable to this document and any and all written or oral communication(s) made by Grip or its directors, employees, associates, representatives and agents. This communication does not constitute advice relating to investing or otherwise dealing in securities and is not an offer or solicitation for the purchase or sale of any securities. Grip does not guarantee or assure any return on investments and accepts no liability for consequences of any actions taken based on the information provided. For more details, please visit www.gripinvest.in
Registered Address - 106, II F, New Asiatic Building, H Block, Connaught Place, New Delhi 110001


