
ROE Vs ROCE: Key Differences Every Investor Should Understand


If you are looking to carry out a financial statement analysis for a company, there are a few things you should keep in mind. First, merely looking at the income statement or balance sheet might give you a slight idea about the company’s profitability and position.
However, it is critical that you take into account various other technical details to ensure you can effectively carry out standalone, comparative, and trend analyses of one or more companies.
There are various ratios and metrics you can use to evaluate companies' financial position and performance. Among the most widely used metrics are Return on Equity (ROE) and Return on Capital Employed (ROCE). Understanding the ROE vs ROCE difference can significantly improve how you evaluate stocks and make investment decisions.
What Is Return On Equity (ROE)
- Definition and Formula
ROE, or Return on Equity, is one of the most popular financial ratios that measures the efficiency of using shareholders’ funds to generate profits. In simple terms, it helps you understand how much return a company generates for every rupee of equity invested.
The ROE formula is as follows:
ROE = Net Income / Shareholders’ Equity
This is commonly used by stakeholders, including the company’s decision-makers, board of directors, and employees, to assess how effectively management utilises equity capital. In addition, ROE calculation for investors helps them understand the profitability and efficiency of the company.
- What ROE Indicates
A high ROE indicates that the company has been efficiently using shareholders’ equity. If you are carrying out a trend or historical analysis, a consistently rising ROE is a good indicator. If you are comparing two companies, the one with a higher ROE should be preferred for investment purposes.
However, one of the primary limitations of ROE for high-debt companies is that it can be artificially inflated by taking on excessive leverage. Hence, the ROE number might be high, but the actual profitability might not be.
What Is Return On Capital Employed (ROCE)
- Definition and Formula
ROCE or Return on Capital Employed is a bit more inclusive than ROE as it takes into account the total capital (equity and debt). Hence, ROCE provides a slightly broader view of the operational performance of the company. The ROCE meaning can be best explained by its formula:
ROCE = EBIT / Capital Employed
Analysts and users of accounting information also refer to this as ROCE formula with EBIT. EBIT or Earnings Before Interest and Tax reflects the operational profitability of a company before considering the financing costs.
- Importance for Capital-Intensive Businesses
ROCE is an important metric, especially when evaluating businesses with significant capital investment requirements. For instance, it might include infrastructure, manufacturing, and utilities companies. The ratio underlines how effectively long-term capital is deployed.
The ROCE for capital-intensive companies is often a better indicator than ROE, as it accounts for both equity and debt. Further, one might acknowledge the importance of ROCE in fundamental analysis, as it provides a clearer picture of the company's financial performance from a long-term perspective.
Key Differences Between ROE And ROCE
Here is a table that depicts the key differences between ROE and ROCE:
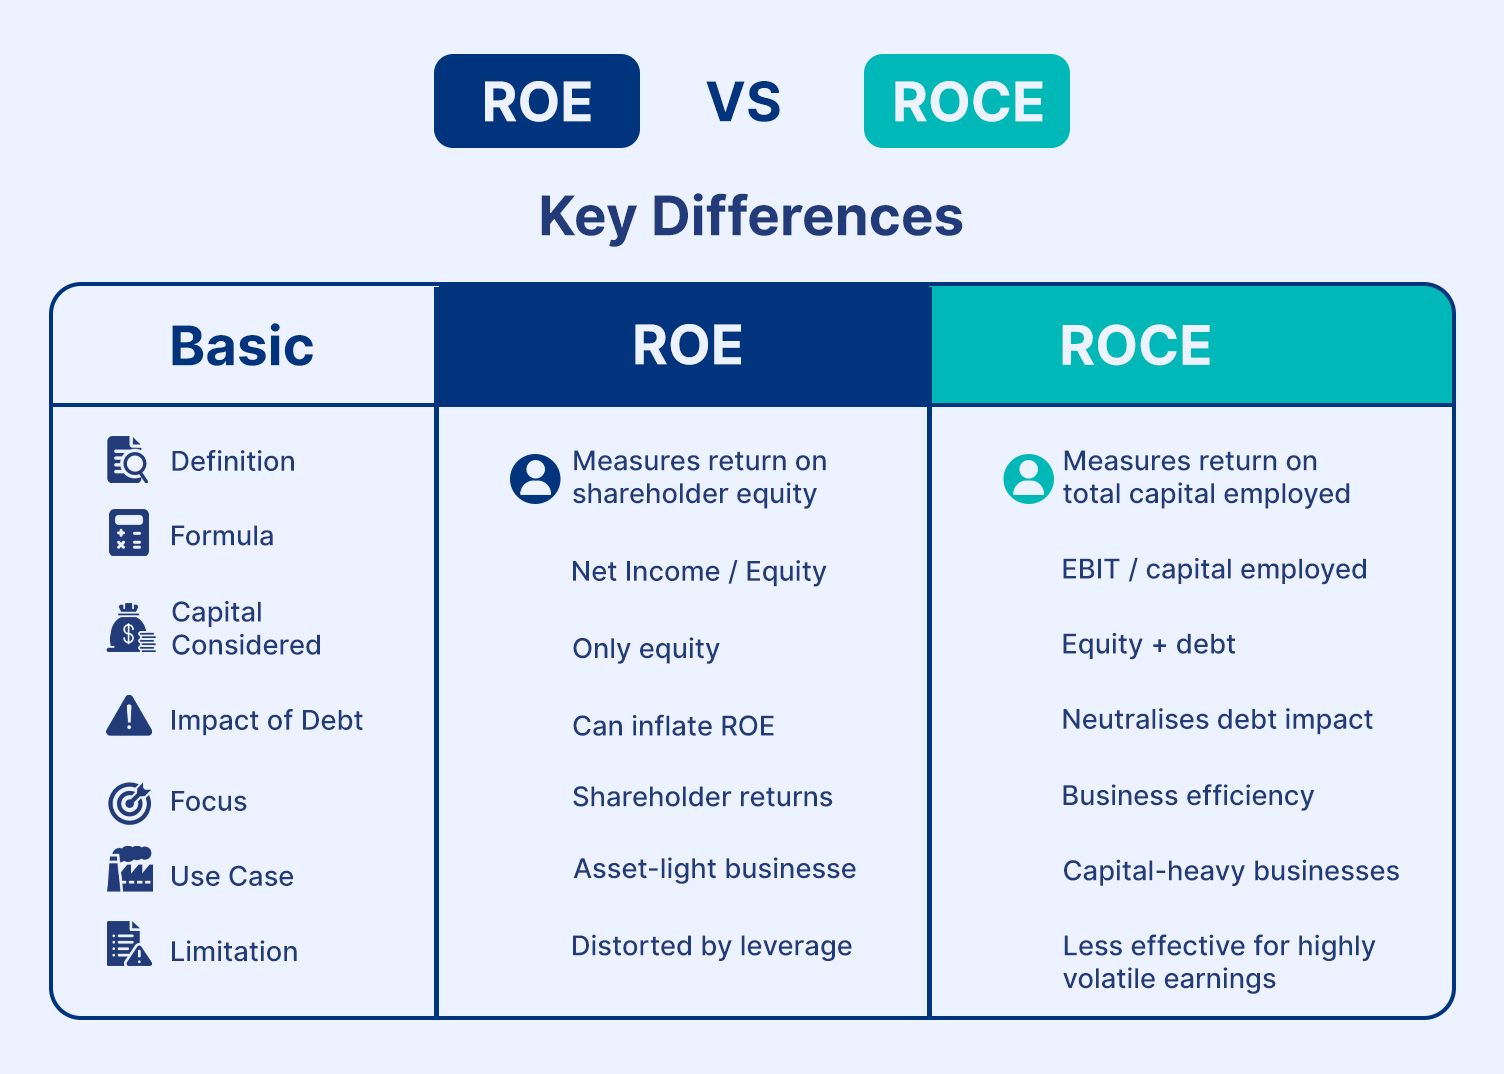
Table 1.0: Key Differences Between ROCE and ROE
Interpretation: The table depicts return on equity vs return on capital employed. The most critical outcome of the comparison is that both are excellent ratios widely used by users of accounting information. However, ROE indicates how well shareholders are rewarded, while ROCE reflects how efficiently the entire business operates.
When Investors Should Use Each Ratio
1. ROE for Equity Efficiency
ROE is best suited for evaluating or comparing companies with low debt levels and stable equity structures. It gives investors an idea about how effectively the capital is utilised. A good ROE and ROCE ratio comparison often begins with ROE, especially in sectors like technology and services, where capital requirements are relatively low.
2. ROCE for Operational Efficiency
On the other hand, ROCE is best suited for situations when analyzing companies that have critical and large capital investments. It focuses on operational performance and long-term sustainability.
For deeper insights, investors rely on ROCE interpretation in stock analysis to determine whether a company is generating returns above its cost of capital. This is particularly useful in sectors like energy, telecom, and infrastructure.
Conclusion
When conducting financial analysis of a standalone company or comparing two or more companies, one of the best ways is to use financial ratios. These ratios provide a clearer picture of companies' financial performance and profitability and are easy to interpret.
When it comes to popular financial ratios, analysts and other users of financial information often rely on ROE and ROCE.
ROE focuses largely on the shareholder returns, whereas ROCE provides a broader view of capital efficiency.
Both of these metrics are quite effective and popular among users and can be used in tandem to evaluate a company's financial performance or to carry out trend or comparative analyses.
FAQs
1. What is the difference between ROE and ROCE?
ROE measures returns generated on shareholders’ equity, while ROCE evaluates returns on total capital (equity + debt). In simple terms, ROE reflects shareholder profitability, whereas ROCE shows overall business efficiency.
2. Which ratio is better for investors?
Neither is universally better. ROE is more useful for asset-light companies, while ROCE is preferred for capital-intensive businesses. Smart investors analyse both together to get a complete picture.
3. Why do analysts use both ratios?
Because each metric highlights a different aspect of performance. ROE focuses on equity returns, while ROCE captures operational efficiency. Using both helps identify whether returns are driven by strong business fundamentals or excessive leverage.
Want to stay at the top of your finances?
Join the community of 4 lakh+ investors and learn more about Grip Invest, the latest financial knick-knacks, and shenanigans in the world of investing.
Happy Investing!
Disclaimer - Investments in debt securities/municipal debt securities/securitised debt instruments are subject to risks including delay and/ or default in payment. Read all the offer related documents carefully. The investor is requested to take into consideration all the risk factors before the commencement of trading.
This communication is prepared by Grip Broking Private Limited (bearing SEBI Registration No. INZ000312836 and NSE ID 90319) and/or its affiliate/ group company(ies) (together referred to as “Grip”) and the contents of this disclaimer are applicable to this document and any and all written or oral communication(s) made by Grip or its directors, employees, associates, representatives and agents. This communication does not constitute advice relating to investing or otherwise dealing in securities and is not an offer or solicitation for the purchase or sale of any securities. Grip does not guarantee or assure any return on investments and accepts no liability for consequences of any actions taken based on the information provided. For more details, please visit www.gripinvest.in
Registered Address - 106, II F, New Asiatic Building, H Block, Connaught Place, New Delhi 110001


