

Tax Buoyancy: Meaning, Formula And Why It Matters For The Economy


Tax collections are the primary way that governments generate revenue to fund the public services, infrastructure, and social programs that support national development every single day.
If the overall economy is growing steadily, we would expect that tax revenues will also grow steadily with it. However, on occasions, tax revenues grow faster than the economy or slower than expected, and this is where tax buoyancy comes into play.
Tax buoyancy is simply used to track the relationship between tax revenue growth and the growth rate of the economy to measure how tax revenue grows in response to economic growth.
Understanding what tax buoyancy is enables citizens, investors, and policymakers to assess the overall health of an economy for the purpose of making future spending decisions and developing fiscal policies. Here, we are going to understand what tax buoyancy is with a complete understanding of all its aspects.
What Is Tax Buoyancy?
Tax buoyancy is the degree to which tax revenues change over time for a defined change in GDP. It illustrates whether tax revenues grow more quickly, slowly, or go hand in hand with the growth of the overall economy.
A buoyancy value greater than 1 indicates that tax revenues are growing at a faster rate than GDP, indicating that the government has an abundant source of tax revenue beyond simply collecting more. Governments prefer to see higher levels of tax buoyancy because they will have more money available to provide services, without having to increase the tax rate on an ongoing basis.
Tax buoyancy formula:
Tax Buoyancy = Percentage Change in Tax Revenue / Percentage Change in GDP
The tax buoyancy ratio calculation provides a convenient means of measuring fiscal efficiency. For example, if GDP grows by 10% and tax revenues grow by 15%, then the buoyancy of tax revenue is 1.5, providing a high degree of sensitivity between the two. The calculation of the tax buoyancy ratio is used to provide an accurate basis for budget forecasts, allowing governments to accurately plan their expenditures.
Tax Buoyancy Vs Tax Elasticity
There can be some confusion between tax buoyancy and tax revenue elasticity India, yet there are significant differences between the two measures, which produce each measure to assist researchers in completing their analysis smoothly. The elasticity of tax revenues in India is adjusted to account for inflation and the effects of legislative changes.
While the measure of tax buoyancy measures only the actual GDP and tax collection India. Tax buoyancy is an immediate reflection of how taxes have impacted actual government policies, such as a tax increase.
| Aspect | Tax Buoyancy | Tax Elasticity |
| Base | Nominal GDP tax sensitivity growth | Real GDP growth |
| Adjustments | None (raw data) | Inflation, policy changes |
| Focus | Short-term responsiveness | Long-term structural |
| Use Case | Budget planning | Economic modeling |
GST buoyancy trends illustrate a more rapid change in the buoyancy-catching rate when compared to the more gradual flattening effect of elasticity over time. For example, if the economy was growing at 8% and taxes rose at 12%, there would be a buoyancy of approximately 1.5. After accounting for inflation, the elasticity would change to approximately 1.1.
India’s Tax Buoyancy Trends
India’s fiscal story demonstrates that tax revenue from the Indian government has increased relative to the total Gross Domestic Product (GDP) in most years. This is due to improved compliance and the gradual expansion of the tax base.
Annual tax revenue growth also includes the effect of goodwill from increased employment and the resulting paid taxes (as typically occurs with increased wages). In addition, GST buoyancy trends improved after its implementation and beyond. This is why compliance with tax laws has significantly improved after reaching a stage when all businesses were formally registered for tax purposes, resulting in increasing growth rates in overall tax collections.
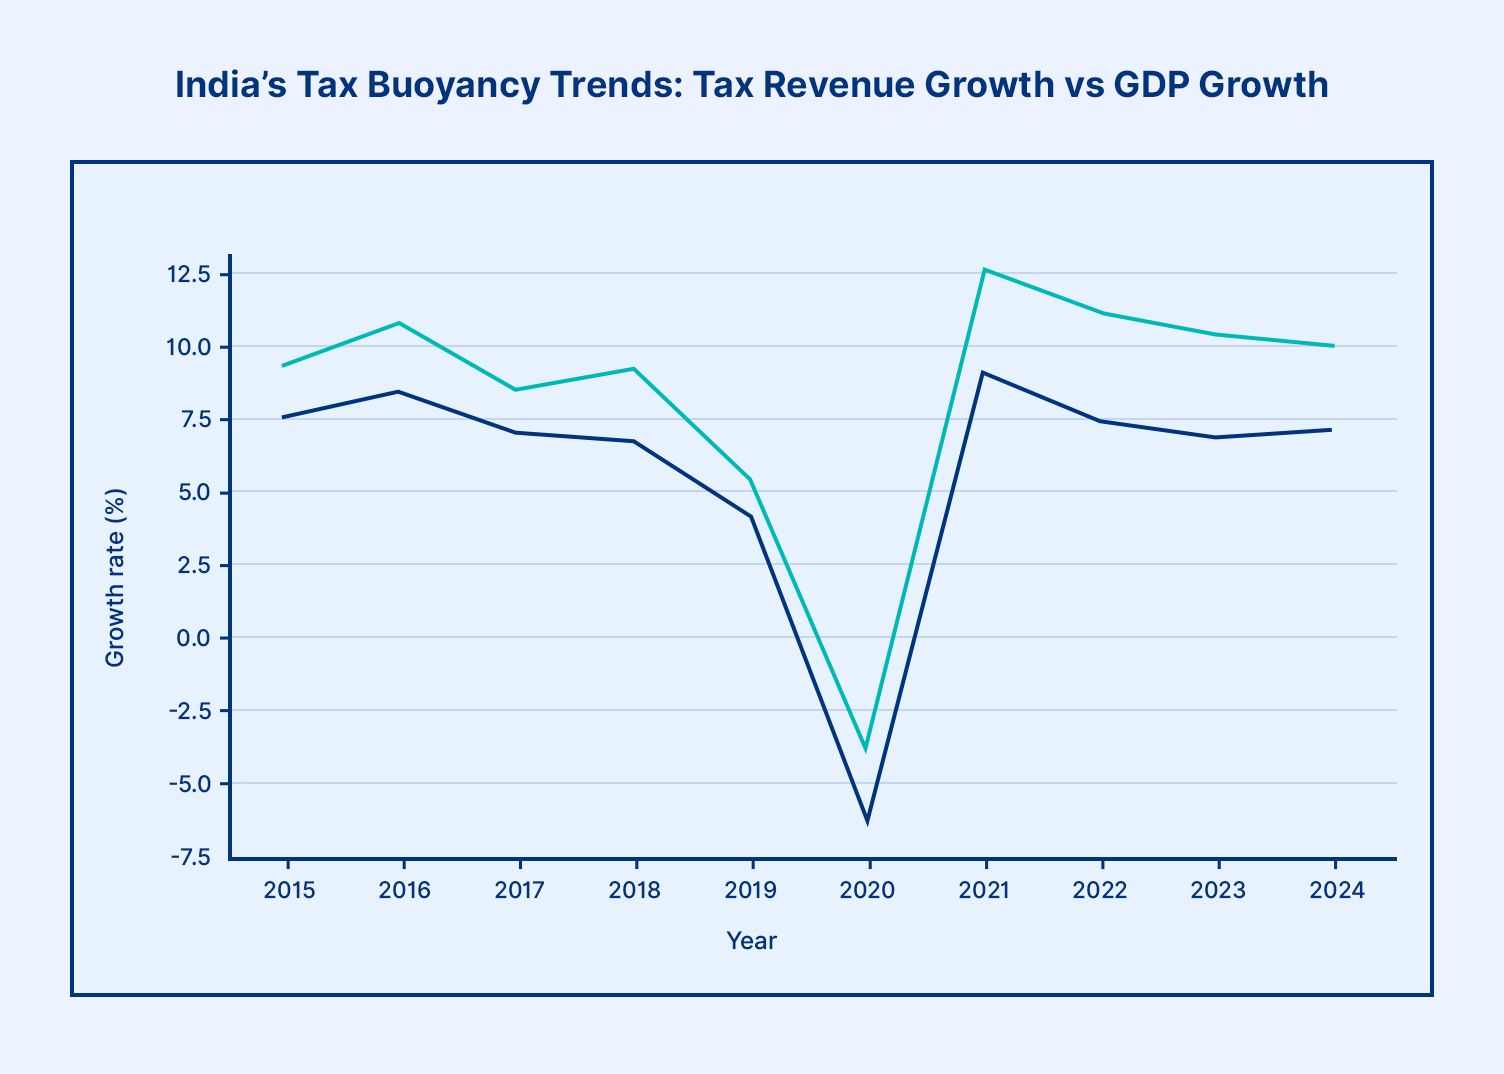
Increased economic activity resulting from COVID-19 business recovery has continued to result in tax revenue collections following GDP growth. Since 2010, a steady reduction in the time, cost, and effort needed to file tax returns through the digitization process has also resulted in improved efficiency of tax revenue collections across India.
Why Tax Buoyancy Matters For Bond Investors
Tax buoyancy is of significant interest to bond investors as high tax revenue means strong government finance, which results in a greater likelihood of sovereign default risk being minimal.
Hypothetical Example
For example, if the growth of tax collections outpaces the growth of the economy (GDP) by a margin of one percent, the fiscal deficit will decline, which means there will be lower borrowing. Both of these items will provide for somewhat consistent yields on bonds, which will cause an influx of capital. When tax buoyancy is low, this indicates that revenue will fall short of expectations, thus increasing both yields and volatility.
For example, strong buoyancy will provide a government with the ability to pay off bonds more quickly, which increases investor confidence. Conversely, weak buoyancy will lead to sell-offs that will increase the cost of borrowing money for everyone. India's tax buoyancy demonstrates a long-term, sustainable trend that positively impacts the ability to pay off government bonds.
Limitations Of Tax Buoyancy
Tax buoyancy has limitations. Tax buoyancy fails to take into consideration policy changes, such as rate changes, that could mask the true economic relationships between the economy and tax revenues. Tax buoyancy is further affected by one-time revenue from asset sales. Additionally, tax buoyancy ignores spending efficiency and only narrowly focuses on revenues.
External shocks, such as a pandemic, will distort tax buoyancy and require economic context at all times. The standard formula for tax buoyancy assumes the structure is stable, which is not true because there are reforms that occur during the fiscal year.
Hypothetically: A rate increase will increase tax buoyancy without reflecting true tax elasticity, but once the rate is increased, the tax buoyancy will represent a lower tax elasticity; this provides investors with more accurate information. Furthermore, it is important to combine the tax buoyancy number with the tax-to-GDP number for India to get accurate measures.
Beyond Basics: Factors Influencing Buoyancy
Enjoy financial trends via fiscal buoyancy measures from digitization to increase base sizes through links with your Aadhar number. Increased indirect taxes through formalising the economy in an upward direction. When times are good and showing rapid growth, collections will increase naturally; however, during slowdowns, things are put to the test. Export taxes are also impacted indirectly via the global trade environment. Government policies, including presumptive taxation processes, have made life easier for small businesses due to increased numbers.
Measuring Buoyancy Over Time
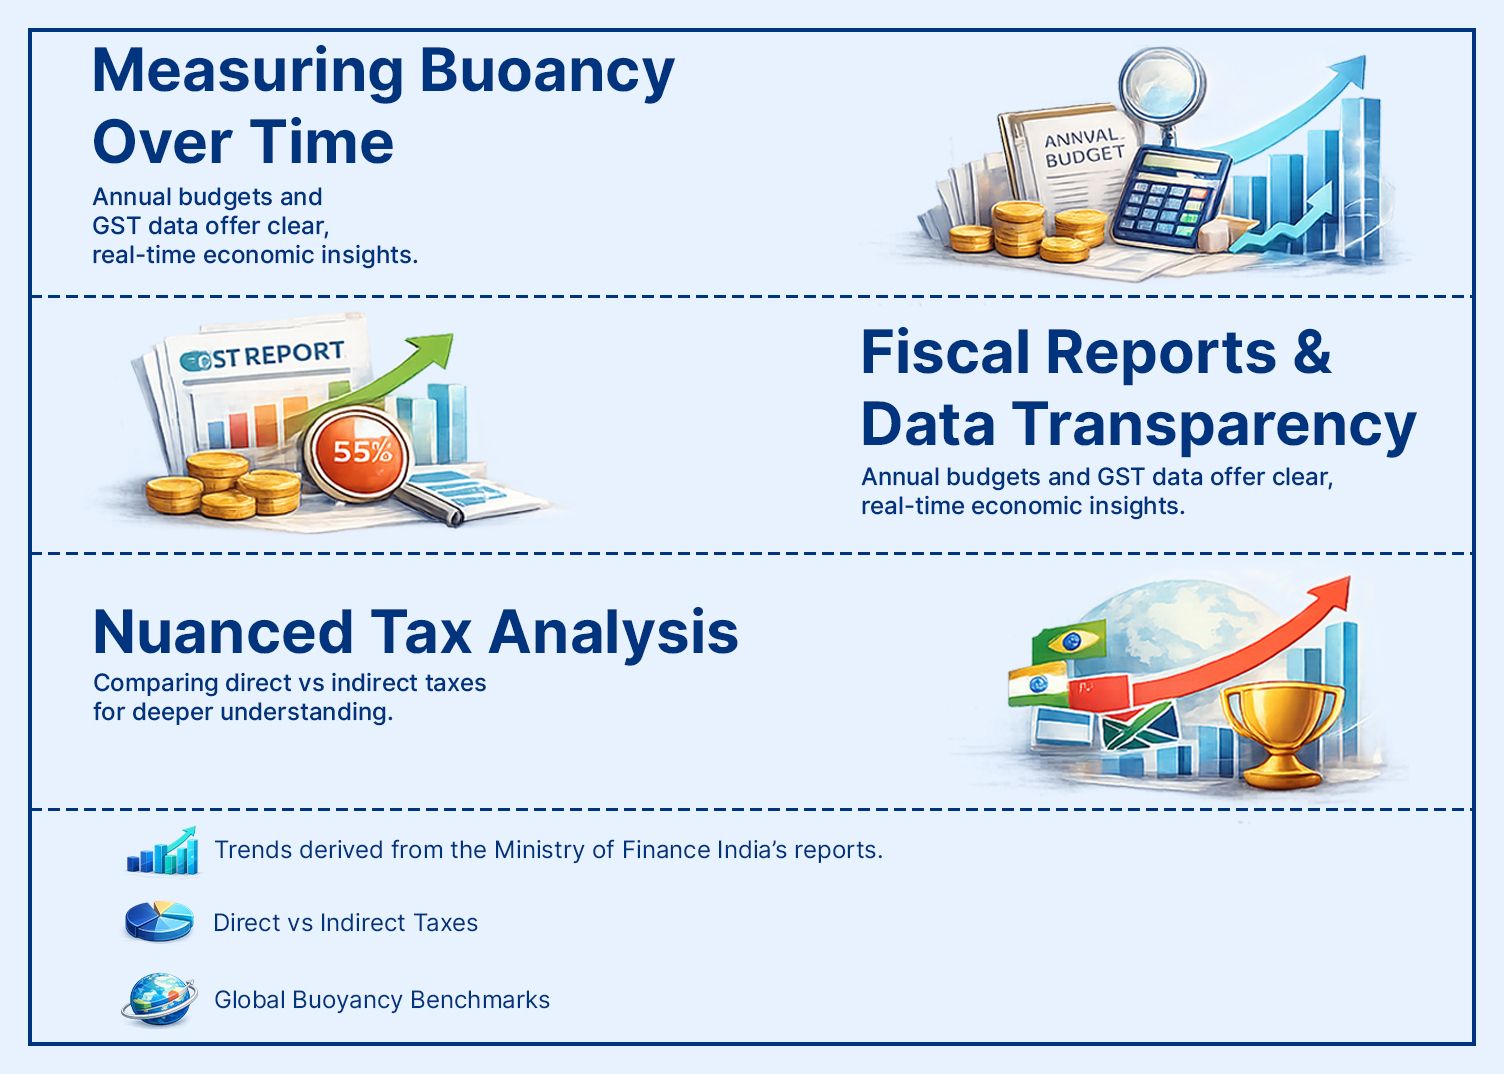
Annual budgets provide evidence of trends over time, with the reports from the Ministry of Finance (India) producing and reporting annual ratios transparently. Reports showing quarterly GST data provide an accurate snapshot of real-time pulse responses to businesses today, which are very widely accessible.
Comparing direct taxes versus indirect taxes will provide a much more nuanced view. Data from international benchmarks show that tax buoyancies (high and low) are consistent with all of India's peers, making it competitive within emerging markets.
Practical Implications For The Economy
High tax buoyancy will provide funding for increased infrastructure growth cyclically, while at the same time, supporting deficit stability and avoiding the crowding out of private credit. It also enables welfare without creating any new money while continuing to keep inflation down long-term.
Low tax buoyancy will place a lot of pressure on programs that are being forced to continue funding by providing funding cuts, which is a significant issue for those individuals who rely heavily on these services for safety nets and support.
Conclusion
Tax buoyancy offers a simple but powerful way to understand how efficiently an economy converts growth into government revenue. When tax collections consistently grow faster than GDP, it signals stronger fiscal capacity, better compliance, and improved budget stability. On the other hand, weak buoyancy can strain public finances and increase borrowing pressure.
For investors, especially fixed income participants, this metric matters more than it appears at first glance. Strong tax buoyancy supports lower fiscal deficits, stable bond yields, and improved sovereign confidence. Weak trends can point toward higher volatility and rising borrowing costs.
Tracking fiscal indicators like tax buoyancy alongside macro trends helps investors make more informed decisions. Platforms like Grip Invest simplify access to fixed-income opportunities, allowing investors to align their portfolios with broader economic signals while targeting predictable returns.
FAQs
1. What does high or low tax buoyancy mean?
The term “tax buoyancy” refers to how sensitive tax revenues are to changes in GDP, and a tax buoyancy ratio of greater than 1.0 exhibits a higher level of responsiveness than GDP does.
2. How is tax buoyancy calculated?
It is calculated by taking one year's percentage increase in tax revenue and dividing it by the percentage increase of GDP for the same year.
3. Why is high tax buoyancy important for the economy?
Tax buoyancy provides stable, ongoing funding for budgets without requiring increases in tax rates, therefore creating a continued increase in investor confidence across the country.
Want to stay at the top of your finances?
Join the community of 4 lakh+ investors and learn more about Grip Invest, the latest financial knick-knacks, and shenanigans in the world of investing.
Happy Investing!
Disclaimer - Investments in debt securities/municipal debt securities/securitised debt instruments are subject to risks including delay and/ or default in payment. Read all the offer related documents carefully. The investor is requested to take into consideration all the risk factors before the commencement of trading.
This communication is prepared by Grip Broking Private Limited (bearing SEBI Registration No. INZ000312836 and NSE ID 90319) and/or its affiliate/ group company(ies) (together referred to as “Grip”) and the contents of this disclaimer are applicable to this document and any and all written or oral communication(s) made by Grip or its directors, employees, associates, representatives and agents. This communication does not constitute advice relating to investing or otherwise dealing in securities and is not an offer or solicitation for the purchase or sale of any securities. Grip does not guarantee or assure any return on investments and accepts no liability for consequences of any actions taken based on the information provided. For more details, please visit www.gripinvest.in
Registered Address - 106, II F, New Asiatic Building, H Block, Connaught Place, New Delhi 110001


