

Are FD Interest Rates Beating Inflation In India?


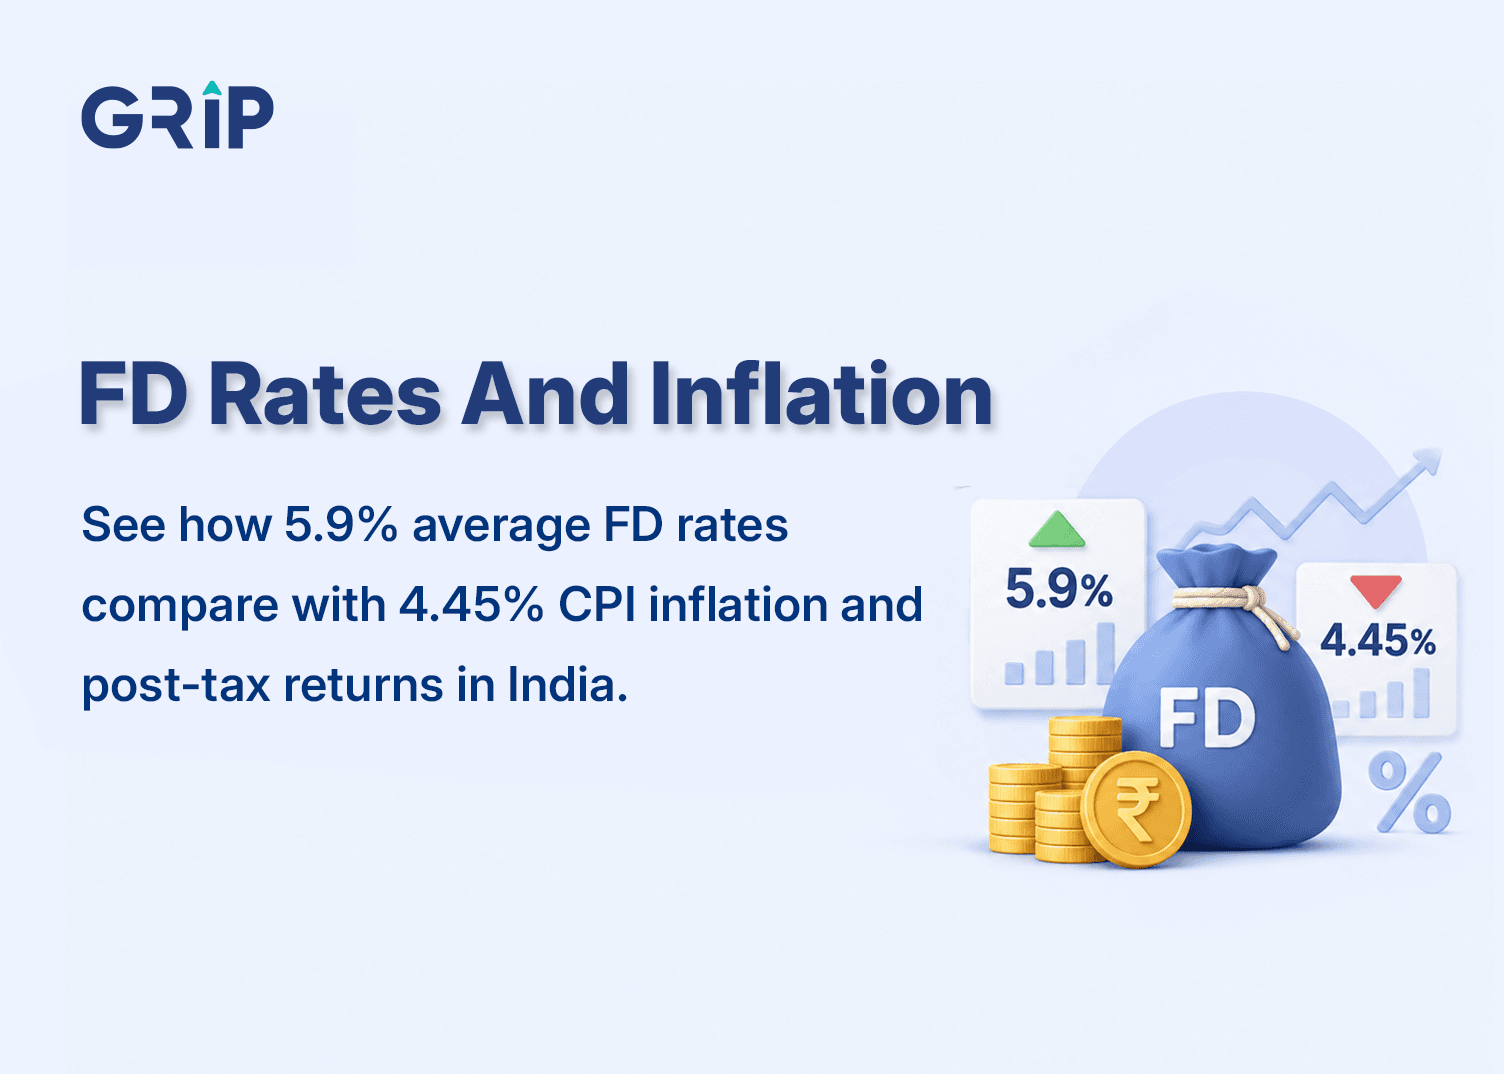
In July 2026, the weighted average rate on fresh rupee term deposits at scheduled commercial banks was 5.9%1. CPI inflation for the same month was 4.45%2. Accordingly, fresh deposits were ahead of inflation by 1.45 percentage points pre-tax.
There is a caveat to reading this as a clear win for every FD investor. The 5.9% is an average, while the actual rate depends on the tenure chosen. Moreover, the relationship between FD interest rates vs inflation is dynamic.
In March 2022, inflation stood at 6.95%, well above the 4.12% average fresh deposit rate. At each March observation from 2023 to 2026, however, deposit rates were higher than inflation.
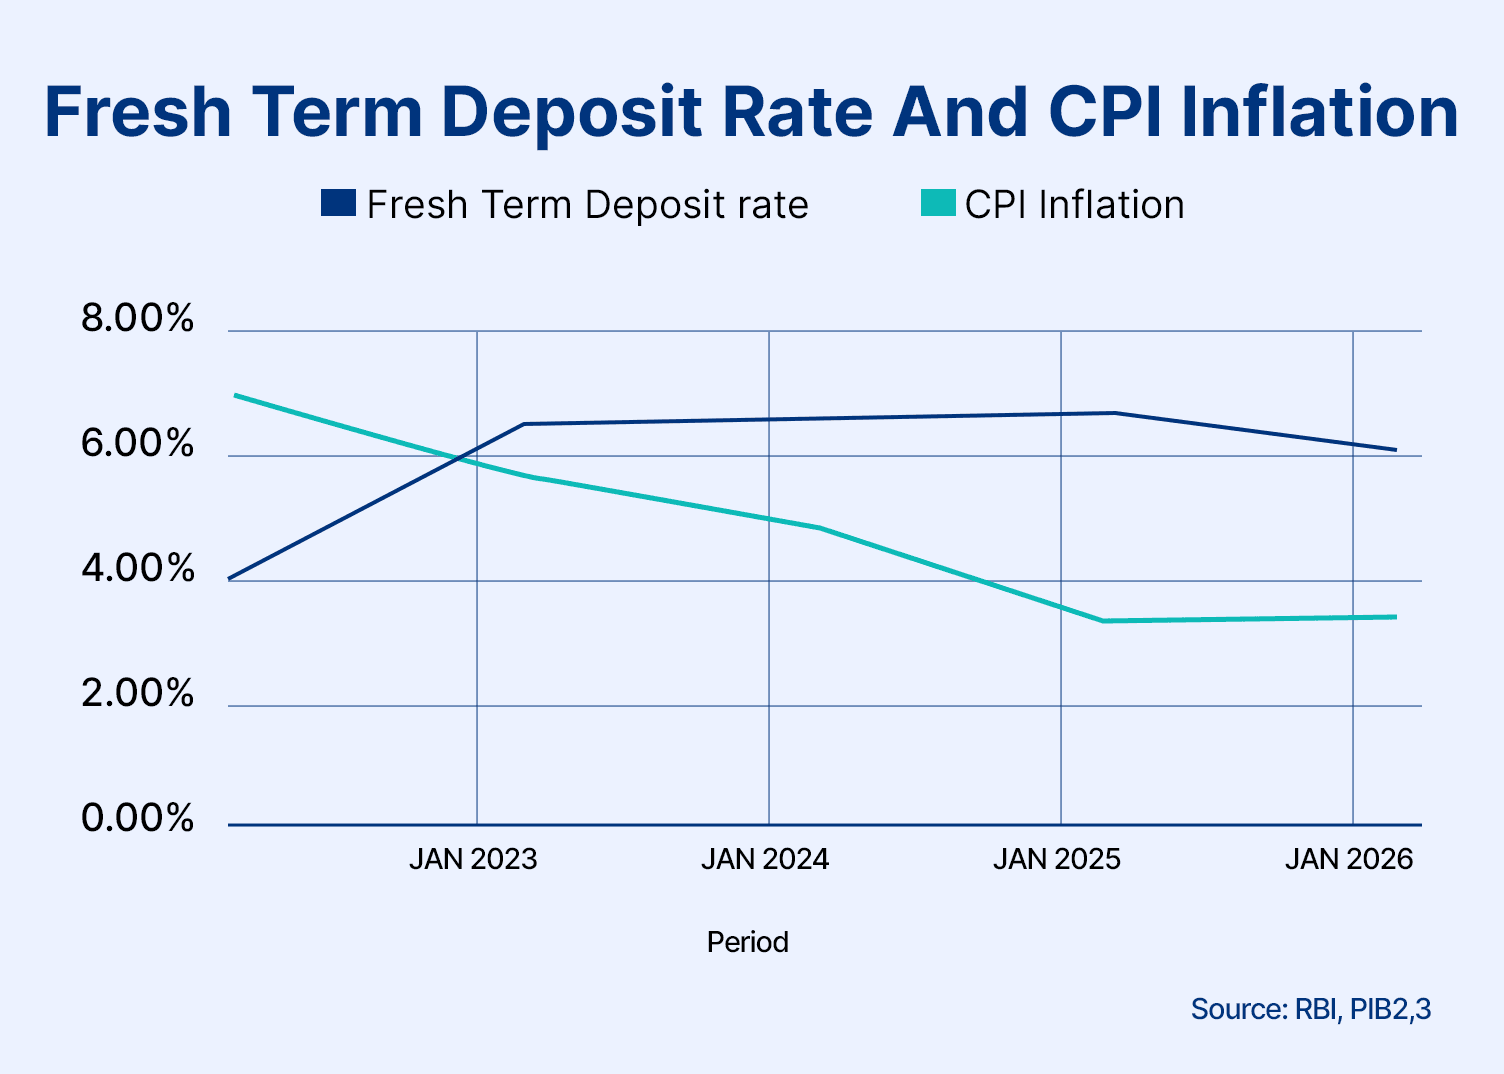
This means an FD can stay ahead of inflation in one period and fall behind in another. And even when the interest rate is higher than CPI inflation, the entire return does not add to purchasing power because rising prices absorb part of it. Tax can reduce what remains further. Therefore, to judge whether the savings hold value, one needs to look at the real return on fixed deposit.
FD Interest Rate vs Inflation: How To Calculate Real Returns?
Real return is the inflation-adjusted FD return.
- Nominal return is the FD rate offered by the bank. Hence, if the bank offers 7%, your investment earns 7% before inflation and tax.
- Inflation rate shows how much prices have risen. Suppose inflation is 5%. Something that cost INR 100 earlier would now cost about INR 105.
- Real return on fixed deposit shows how much purchasing power the FD has actually added after inflation. Because if the FD earns 7% while prices rise by 5%, the full 7% is not a real gain, as part of it only offsets higher prices. The balance is the actual growth when comparing purchasing power.
For 7% FD and 5% inflation, the difference is 2 pp. This gives a rough idea of the gain, but it is not the exact real return because inflation also changes the purchasing-power base. To be more precise, use:
Real return (%) = [((1 + nominal return) / (1 + inflation rate)) - 1] x 100
For example, assume the previous 7% FD with 5% inflation:
Real return = ((1 + 0.07) / (1 + 0.05)) - 1
= (1.07 / 1.05) - 1
= 1.019 -1 = 0.019
Real return = 1.9%
To see how inflation-adjusted FD return works in practical terms, consider HDFC Bank FD offering 6.25% for a tenure of 1 year to less than 15 months from 19 August 2026. Against July 2026 CPI inflation of 4.45%.
Assumed tax rate (%) | FD return after tax (%) | Inflation-adjusted FD return(%) |
0 | 6.25 | 1.72 |
20 | 5 | 0.53 |
30 | 4.38 | -0.07 |
Source: HDFC5
The 6.25% rate remains the same, but the investor does not retain the same real gain. Inflation first reduces the purchasing-power benefit, while tax cuts the return further. At a 30% tax rate, the post-tax FD return falls below inflation and the real return turns slightly negative. This is where the tax treatment of FD interest starts to matter more.
How Tax Affects Your FD Returns After Inflation
The difference comes from how FD interest is taxed. It is added to taxable income and taxed at the investor’s applicable rate. As the tax rate rises, less of the interest remains to offset inflation.
Before the final tax is settled, the bank may deduct TDS (Tax Deducted at Source). It is generally deducted at 10% when annual interest crosses INR 50,000 for most depositors or INR 1 lakh for senior citizens. But TDS is only an advance tax collection. If the investor’s actual tax rate is higher, the remaining tax still has to be paid.
Now put tax and inflation together. With inflation at 5%, this is how different FD rates work out after a 30% tax rate.
FD rate (%) | Pre-tax real return (%) | Post-tax FD return (%) | Post-tax real return (%) |
6 | 0.95 | 4.2 | -0.76 |
7 | 1.9 | 4.9 | -0.1 |
8 | 2.86 | 5.6 | 0.57 |
Health and Education Cess of 4% also applies on the income tax, along with any applicable surcharge. For simplicity, the calculation excludes cess.
One can observe that a 6% FD starts above 5% inflation, but post-tax FD returns fall to 4.2%, taking the real return to -0.76%. A 7% FD also sinks below inflation after tax. Even at 8%, only 0.57% remains as real return.
So both tax and inflation influence how much of the FD return the investor actually keeps in real terms. But inflation itself is not felt equally by everyone, because household spending patterns can differ from person to person.
Why Your Personal Inflation Rate May Be Higher Than CPI Inflation
Headline CPI is built from a standard spending basket, so each expense does not affect the index equally. Under the CPI series used in 2026, food and beverages carry a 36.75% weight, while health carries 6.10%6. Because food has a much larger weight, a rise in food prices has a stronger effect on headline CPI than the same rise in healthcare costs.
The problem is that prices within these categories also rise at different rates. In July 20267:
- Food and beverages rose 5.24%.
- Housing and related costs rose 2.16%.
- Health costs rose 1.34%.
- Transport rose 4.43%.
- Education services rose 3.64%.
- Restaurants and accommodation services rose 7.72%.
Consequently, a household with high rent and education costs may feel inflation differently from one spending more on food and transport. A young professional may spend more on rent and travel, while a family with children may feel school and food costs more. A retiree may be more affected by healthcare expenses.
For example, consider a retiree who spends 25% of the monthly budget on healthcare, compared with the 6.10% health weight in CPI. Their own medical expenses may also rise faster than the official health inflation rate. Suppose those costs increased by 8% over the year.
Each category contributes to personal inflation based on two things: how much of the budget it takes up and how much that cost has risen. If healthcare accounts for 25% of spending and rises 8%, its contribution is:
25% x 8% = 2 pp
The same calculation can then be applied across the household budget.
Expense category | Share of spending (%) | Inflation assumed (%) | Contribution to personal inflation (pp) |
Healthcare | 25 | 8 | 2 |
Food and beverages | 35 | 5.24 | 1.834 |
Housing and related costs | 15 | 2.16 | 0.324 |
Transport | 10 | 4.43 | 0.443 |
Other expenses | 15 | 3 | 0.45 |
Total | 100 | 5.051 |
These contributions give the retiree an estimated personal inflation rate of about 5.05%, compared with headline CPI of 4.45%. If personal inflation is higher than headline CPI, the FD has a smaller real return than the national figure suggests. If it is lower, the investor may retain a larger real return.
Therefore, before judging an FD’s real return, look at your own spending first:
- Identify the three expenses that take up most of your monthly budget.
- Check how much those costs have risen over the past year.
- Give more weight to categories where both spending and price increases are high.
That tells you whether the FD is keeping up with your own expenses during its current tenure. But if your financial goal is longer than that tenure or you plan to reinvest the maturity amount, reinvestment risk becomes relevant.
FD Reinvestment Risk: What Happens When Interest Rates Fall?
Reinvestment risk arises because an FD locks the interest rate only for its chosen tenure. Once it matures, any amount reinvested earns the rate available then. If rates have fallen, the next FD will offer a lower return.
Take INR 1 lakh over a three-year period. Locking 7% for all three years takes the amount to about INR 1,22,504.
Now assume the investor instead chooses a one-year FD and renews it twice. The first year earns 7%, but the renewal rates fall to 6.5% and then 6%. The final value drops to about INR 1,20,792 because each lower renewal rate reduces the amount earned in the following year.
At 5% annual inflation, INR 1 lakh would need to grow to about INR 1,15,763 after three years just to preserve purchasing power.
Strategy | Year 1 rate | Year 2 rate | Year 3 rate | Value after 3 years | Inflation-adjusted FD return(%) |
3-year FD locked at 7% | 7% | 7% | 7% | INR 1,22,504 | 5.82% |
1-year FD renewed annually | 7% | 6.5% | 6% | INR 1,20,792 | 4.35% |
Both strategies remain ahead of inflation in this example, but the margin is smaller with annual renewals because the original 7% rate could not be retained for all three years.
A longer FD reduces reinvestment risk by locking the rate, while a shorter FD offers more flexibility. The trade-off is between rate certainty and access to the money.
Are Fixed Deposits A Good Hedge Against Inflation?
Yes, FDs can help preserve purchasing power when the real return stays positive. In other words, the post-tax FD returns should still be higher than the inflation the investor actually experiences.
But that does not make an FD a dependable long-term inflation hedge. Inflation can change during the tenure, while the FD rate remains fixed. Once the deposit matures, the next rate may also be different. The protection against inflation therefore depends on the gap that remains between the return and inflation over time.
The current rates (as of 13 August 2026) across selected banks show how much of a pre-tax cushion FDs have over July 2026 CPI inflation of 4.45%.
Bank | 1-year FD rate (%) | Margin over inflation (pp) | 3-year FD rate (%) | Margin over inflation (pp) | 5-year FD rate (%) | Margin over inflation (pp) |
Yes Bank | 6.65 | +2.20 | 7.00 | +2.55 | 6.75 | +2.30 |
Karur Vysya Bank | 6.55 | +2.10 | 6.55 | +2.10 | 6.25 | +1.80 |
Axis Bank | 6.25 | +1.80 | 6.50 | +2.05 | 6.50 | +2.05 |
HDFC Bank | 6.25 | +1.80 | 6.45 | +2.00 | 6.40 | +1.95 |
Punjab National Bank | 6.25 | +1.80 | 6.30 | +1.85 | 6.35 | +1.90 |
Source:Bank Bazaar8
All these rates are above headline inflation before tax, but the margin differs by bank and tenure. This also shows why a higher tenure does not automatically mean better protection against inflation.
That is why FDs are better suited to capital stability and predictable income than to long-term inflation protection. They can work well for near-term goals, emergency reserves, conservative investors and those who need predictable cash flows.
For longer goals, different assets may be needed for different purposes and time horizons.
How To Choose An FD That Can Beat Inflation
Since an FD does not automatically stay ahead of inflation, the highest advertised rate should not be the only filter. The rate has to work for the tenure you need and still leave enough return after tax and inflation.
- Compare the exact tenure rate: Banks change FD rates across maturities, so the highest advertised rate may apply only to a particular period. If your required tenure offers a lower rate, that is the rate that should be compared with inflation.
- Calculate the post-tax real return: A rate may be above inflation before tax and still leave little real growth afterwards. Hence, apply your tax rate to the interest first and then compare FD rates after tax with inflation.
- Check how the interest is paid: Choose a cumulative FD if you want the interest to stay invested and compound. Choose a periodic payout FD if you need regular income during the tenure.
- Account for liquidity: Check the bank’s premature-withdrawal rules and penalty before choosing the tenure, especially if you may need the money earlier.
- Check senior-citizen FD rates: Eligible investors may get a higher rate. Use that actual rate, rather than the regular FD rate, when working out the post-tax real return.
- Match maturity with the goal: The tenure should roughly match when the money is needed. For a longer goal, weigh the benefit of locking in for longer against the reinvestment risk of shorter FDs.
The better comparison is therefore not simply which FD pays the highest rate, but which one leaves the strongest usable return for the period the money actually needs to stay invested.
FAQs On FD Interest Rates Vs Inflation Of 2026
Want to stay at the top of your finances?
Join the community of 4 lakh+ investors and learn more about Grip Invest, the latest financial knick-knacks, and shenanigans in the world of investing.
Happy Investing!
Disclaimer - Investments in debt securities/municipal debt securities/securitised debt instruments are subject to risks including delay and/ or default in payment. Read all the offer related documents carefully. The investor is requested to take into consideration all the risk factors before the commencement of trading.
This communication is prepared by Grip Broking Private Limited (bearing SEBI Registration No. INZ000312836 and NSE ID 90319) and/or its affiliate/ group company(ies) (together referred to as “Grip”) and the contents of this disclaimer are applicable to this document and any and all written or oral communication(s) made by Grip or its directors, employees, associates, representatives and agents. This communication does not constitute advice relating to investing or otherwise dealing in securities and is not an offer or solicitation for the purchase or sale of any securities. Grip does not guarantee or assure any return on investments and accepts no liability for consequences of any actions taken based on the information provided. For more details, please visit www.gripinvest.in
Registered Address - 106, II F, New Asiatic Building, H Block, Connaught Place, New Delhi 110001
Want to stay at the top of your finances?
Join the community of 22 lakh+ investors and learn more about Grip Invest, the latest financial knick-knacks, and shenanigans in the world of investing.
Happy Investing!
Disclaimer - Investments in debt securities/municipal debt securities/securitised debt instruments are subject to risks including delay and/ or default in payment. Read all the offer related documents carefully. The investor is requested to take into consideration all the risk factors before the commencement of trading.
This communication is prepared by Grip Broking Private Limited (bearing SEBI Registration No. INZ000312836 and NSE ID 90319) and/or its affiliate/ group company(ies) (together referred to as “Grip”) and the contents of this disclaimer are applicable to this document and any and all written or oral communication(s) made by Grip or its directors, employees, associates, representatives and agents. This communication does not constitute advice relating to investing or otherwise dealing in securities and is not an offer or solicitation for the purchase or sale of any securities. Grip does not guarantee or assure any return on investments and accepts no liability for consequences of any actions taken based on the information provided. For more details, please visit www.gripinvest.in
Registered Address - 106, II F, New Asiatic Building, H Block, Connaught Place, New Delhi 110001


