
Nifty 50 Crash Explained: Why Markets Fall And What Investors Should Do?


A stock market crash in India is one such phase where the price movement might reflect collective fear, liquidity stress, and shifting economic or market realities.
In this context, a Nifty crash represents a significant and measurable decline in the Nifty 50 index, the benchmark indicator of the National Stock Exchange (NSE) in India. During this, the market might drop more than 10-15% in consecutive trading sessions1. Nifty fall reasons grab attention due to their effects on retail investors, mutual fund holders, and institutional players, panic selling among investors, and the overall health of the Indian economy.
The image below represents the volatile path of NIFTY 50 in FY26:
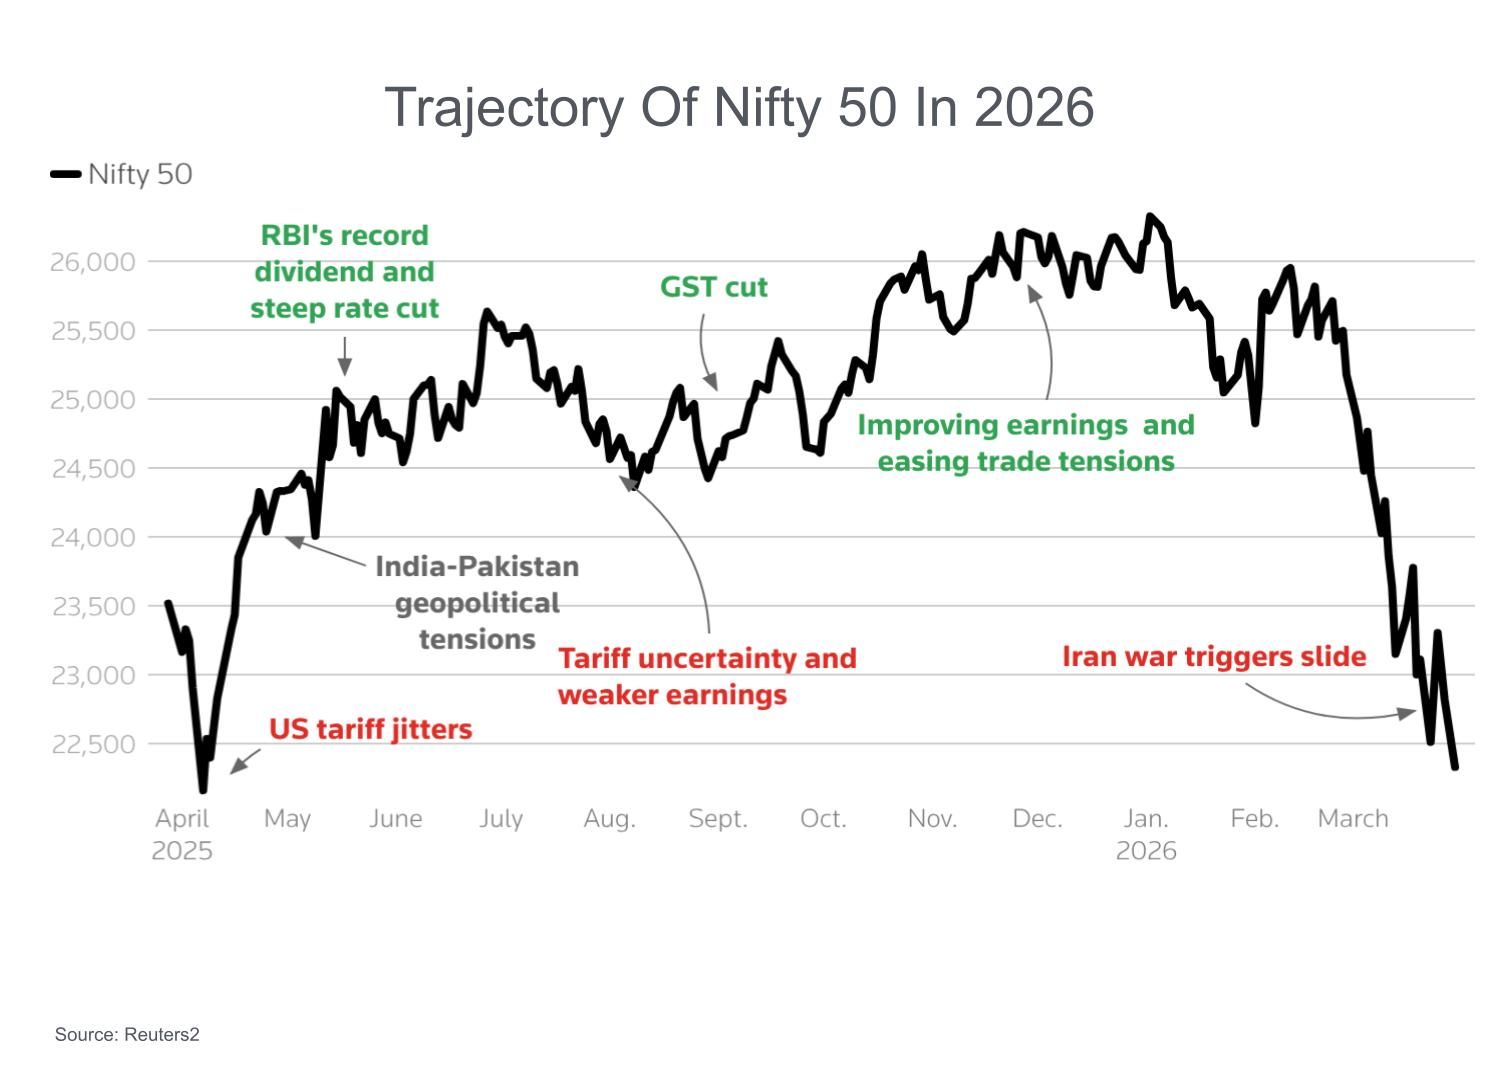
On 19 March 2926, the Nifty dropped about 776 points (3.26%), marking its biggest single-day fall since 4 June 2024, driven by the recent war in West Asia, which drove Brent crude prices higher, along with a hawkish US Federal Reserve stance and a weakening Indian rupee3. This blog decodes the Nifty stock market crash in India, its impact, and investor must-knows.
What Is The Nifty 50 Index?
Nifty 50 is a free-float market capitalisation-weighted index, comprising 50 large-cap companies from 13 key sectors of the Indian economy, such as banking, oil and gas, IT, automotive, and consumer goods. It is constructed and maintained by NSE Indices, reflecting the market trend through its leading constituents4.
In the Indian stock market, the Nifty 50 acts as a barometer of investor sentiment, which rises with optimism and falls with caution. It serves as a benchmark for index funds and ETFs, which guide the performance of a portfolio. Meanwhile, its long-term trend highlights wealth creation possibilities, and diversification across sectors offers relatively stable risk compared to individual stocks.
Major Reasons Behind A Nifty Crash In 2026
Under certain conditions, the Nifty crash in 2026 emerged from the interaction of global, domestic, and psychological forces. These factors combined to amplify the scale of the stock market crash in India.
1. Global Factors (recession fears, US Fed rate hikes)
One of the key Nifty fall reasons is that the stock market turned weak, as US recession risk is estimated at 40%, interest rates at multi-year highs, and crude oil nearing USD 120/barrel5. This tight liquidity environment led to strong foreign investor selling, putting continuous pressure on Indian markets.
2. Domestic Factors (inflation, policy changes)
Within India, investors lost around INR 1.34 lakh crore in FY26, while the Sensex fell 7% and Nifty dropped 5%. Additionally, high inflation and rising bond yields reduced valuation comfort and kept overall market momentum weak.
3. Geopolitical Events (wars, oil shocks)
The tensions in West Asia drove a significant market reaction. On 30 March 2026, the Sensex fell 1,636 points, while the NIFTY 50 dropped 488 points, as global instability intensified. Brent crude oil prices surged amid the conflict, while the rupee hit a record low of 95 per USD, and bond yields crossed 7%, amplifying market stress.
4. Market Sentiment And Panic Selling
In high volatility sessions, the market behaviour turned significantly negative as selling intensified across the board. The Sensex fell over 1,400 points, while the NIFTY 50 slipped below 22,250, declining nearly 500 points intraday6.
In such conditions, over INR 11 lakh crore in market capitalisation was wiped out, reflecting panic-driven liquidation and a reversal of previous gains.
Historical Nifty Crashes In India
The following Nifty history crash phases show: declines driven by external shocks, followed by eventual recovery. Studying these patterns helps identify recurring trends, enabling more informed projections and better investment decisions across market cycles.
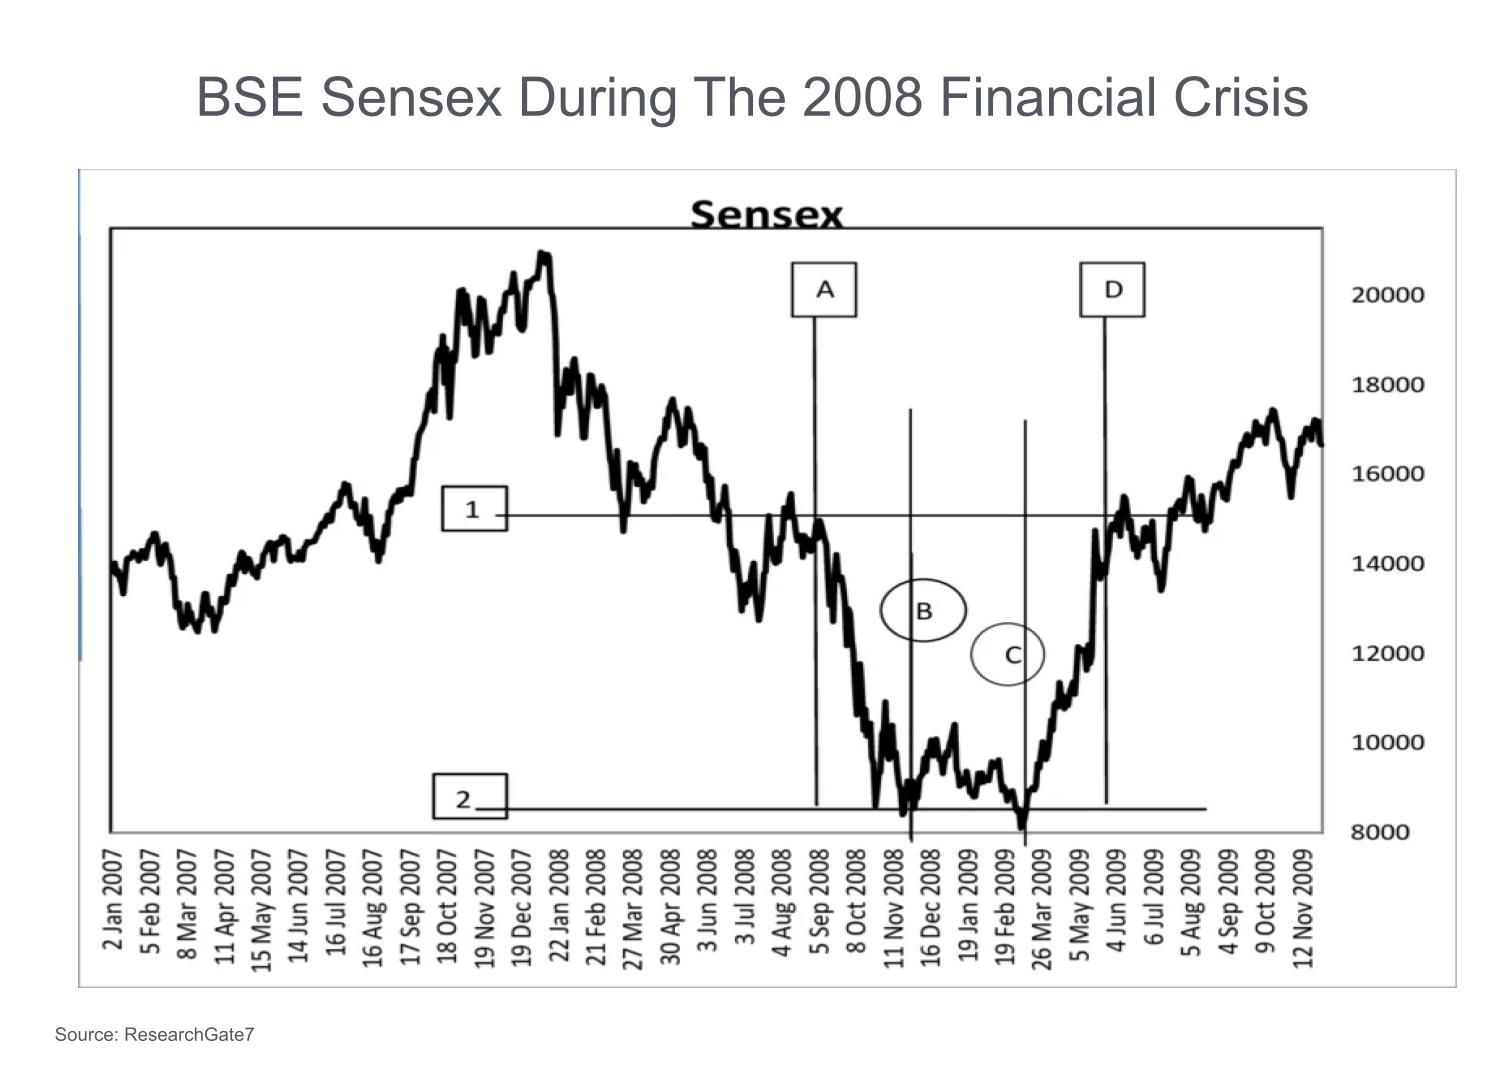
1. 2008 Financial Crisis
In January 2008, the Sensex dropped 1,408 points to 17,605, followed by another 875-point fall the next day, with an intra-day plunge of 2,273 points. By October, it crashed to 8,701, marking a decline of over 60% from the peak levels, with repeated circuit breaks and volatility throughout the year. This period stands as a classic example of a full-scale stock market crash in India.
The following chart shows the rise, sharp collapse, and gradual recovery of the BSE Sensex during the 2008 financial crisis, highlighting the peak-to-bottom decline and subsequent rebound phase.
2. 2020 COVID Crash
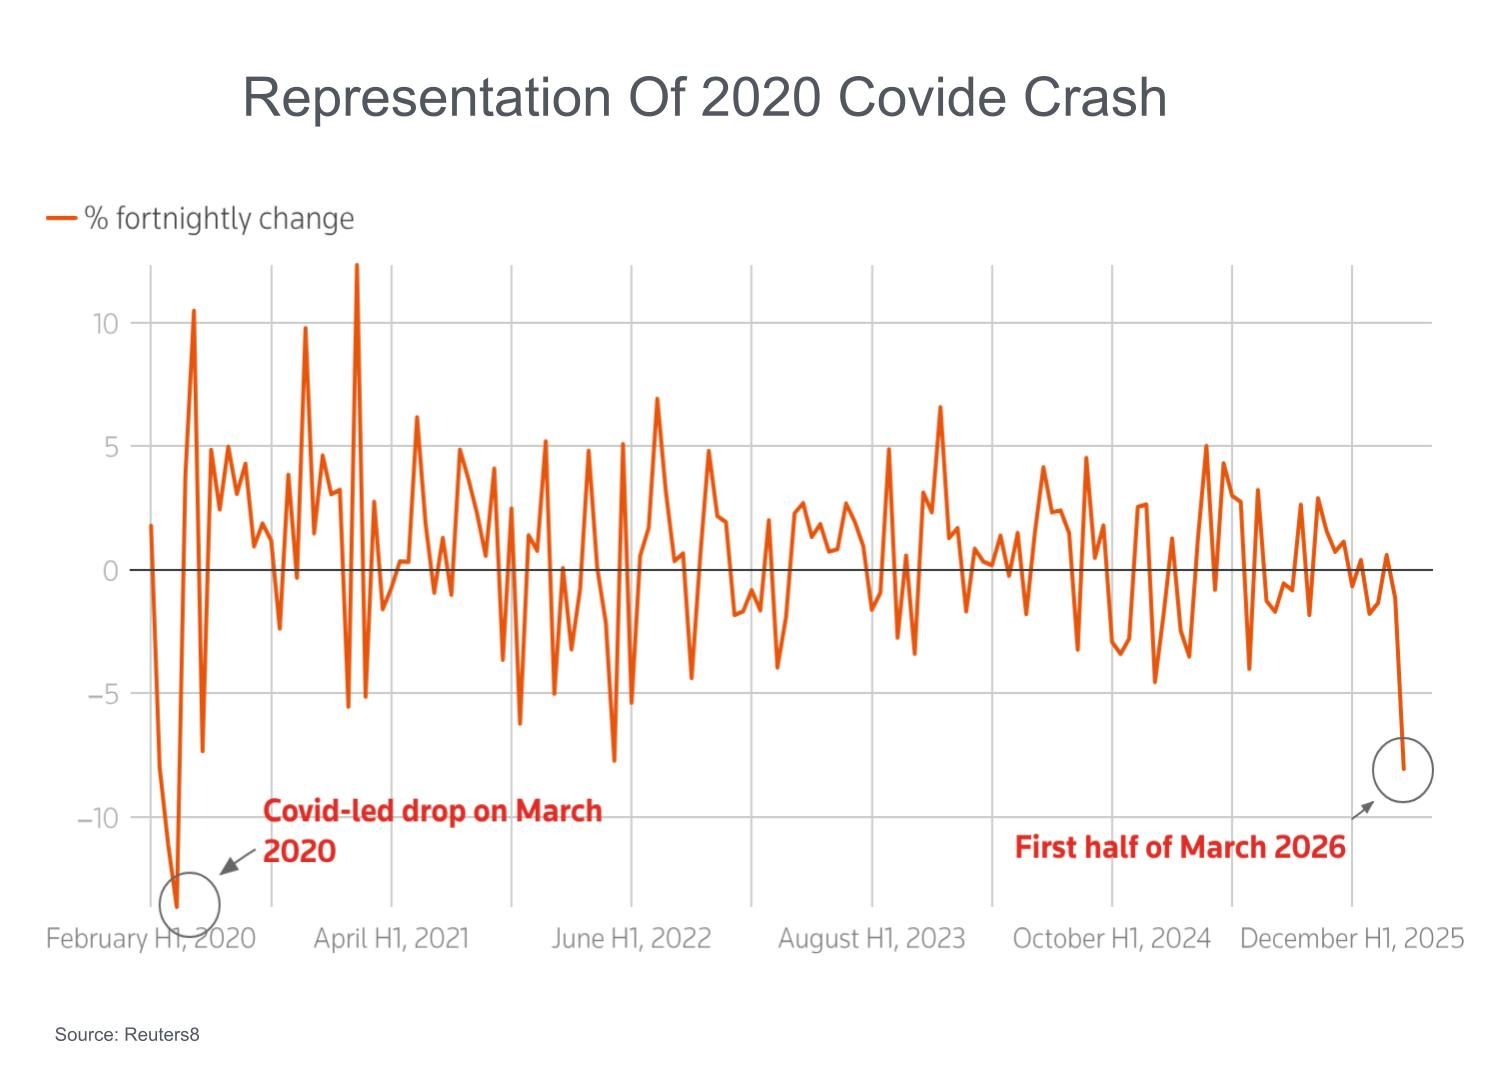
The Nifty crash of 2020 was driven by the global spread of COVID-19 and the economic shutdown that followed. On 1 February, Nifty fell 3% (374 points), followed by repeated shocks, including a 1,941-point Sensex fall on 9 March and an 8% drop on 16 March. The climax came on 23 March, with Sensex plunging 3,934 points (13.15%) and Nifty collapsing 1,135 points (12.98%) to 7,610, marking a panic-driven liquidation due to fears of global lockdowns and recession.
The image is a graphical representation of the 2020 COVID-19 crash:
The following case highlights a market correction vs crash situation:
3. 2018 Correction (LTCG tax impact):
In February 2018, markets reacted to the introduction of a 10% LTCG tax. The Sensex fell 600 points in two days, while the NIFTY 50 dropped 400 points to 10,676, showing a policy-driven correction rather than a full Nifty crash.
The historical patterns of the stock market crash in India show that crashes are significant and short-lived, unlike prolonged bear phases. The data indicate that panic selling, global shocks, and valuation excesses are recurring triggers behind market crashes in India. And, the biases of market correction vs crash are within speed and intensity, with crashes being more abrupt.
Source: Hindustan Times9
Also Read: 5 Biggest Stock Market Crashes in Indian History And Their Causes
How A Nifty Crash Impacts Investors?
Here is how a Nifty crash impacts investors:
A. Portfolio value erosion
A Nifty crash directly reduces investor wealth through mark-to-market losses. In FY26, investors saw wealth erosion of about INR 1.34 lakh crore, while the index itself declined over 5%, reflecting broad-based portfolio damage across equities.
B. Impact on mutual funds and SIPs
The equity mutual funds recorded losses of up to 48% on SIP investments, with 486 out of 556 funds in negative territory, in FY2610. Additionally, short-term SIP returns also turned negative, with one-year returns falling up to 15.38% in some categories.
C. Sector-wise impact
During corrections, sectors like technology and small-cap funds saw significant declines, with some funds falling over 30-47%. At the same time, certain segments, such as PSU banks, showed relative resilience, highlighting uneven sectoral impact during a stock market crash in India.
What Should You Do During a Market Crash?
From a practical standpoint, what to do in a market crash becomes clear through history: markets tend to recover over time, and periods of decline precede long-term opportunity phases within the Nifty history crash cycle.
1. Avoid panic selling
The historical Nifty crash phases show that panic exits usually occur near short-term bottoms, where volatility is highest, and price discovery is still unfolding.
2. Continue SIPs
Systematic investing works through volatility. During declines, the same investment buys more units, lowering the average cost. Over a full Nifty history crash cycle, this averaging effect improves long-term return potential despite short-term losses.
3. Look for buying opportunities
The stock market crash in India reset valuations across sectors. The strong companies with stable earnings often trade at discounted levels, creating entry points. This is where what to do in a market crash shifts from defence to selective accumulation.
4. Asset allocation strategy
A balanced allocation across equity, debt, and other assets helps absorb shocks. During a stock market crash in India, diversification limits downside impact and provides liquidity to rebalance portfolios as conditions stabilise.
Nifty Recovery After Recent Volatility
While market corrections can create uncertainty, the Nifty 50 has also shown periods of recovery after sharp declines. Recently, the index gained momentum as global cues improved and concerns around crude oil prices eased. The Nifty 50 moved higher along with broader market sentiment, showing how quickly indices can recover when investors regain confidence.
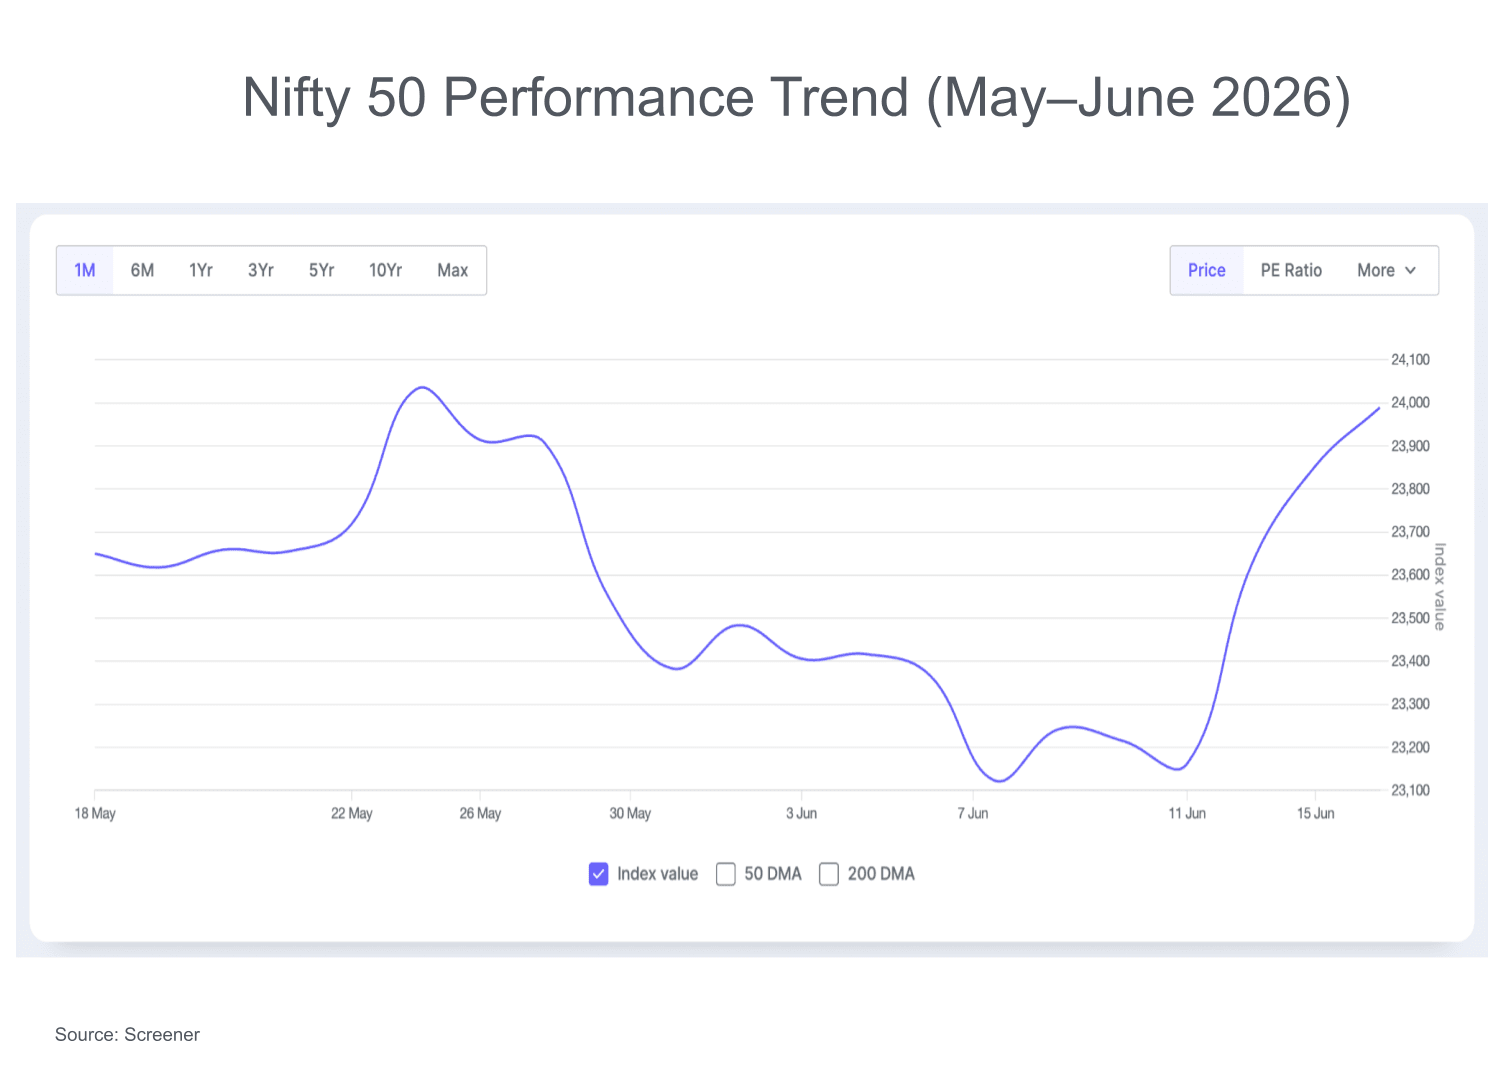
Some key factors supporting the recovery include:
- Easing geopolitical concerns
- Lower crude oil pressure on inflation
- Improved investor sentiment
- Buying interest in major sectors like banking and technology
Building A Crash-Resilient Portfolio
Structuring investments can absorb shocks and stay aligned with long-term trends.
I. Diversification across asset classes
A balanced portfolio can mitigate risk across equities, debt, and alternative assets. During a Nifty crash, different asset classes react differently, reducing overall volatility. This approach helps balance drawdowns in equities with stability from other segments.
II. Importance of fixed-income investments
The fixed-income instruments can act as a stabilising force when markets decline, by offering relatively predictable returns and lower volatility. Grip Invest, registered under SEBI, offers access to regulated, credit-rated instruments such as corporate bonds and SDIs, enabling investors to balance volatility with steady income and strengthen portfolio resilience across market cycles.
Conclusion
A Nifty crash reflects a phase where markets transition from optimism to uncertainty, driven by shifting global and domestic conditions. While declines may appear sudden, they are part of broader market cycles. History shows that such phases eventually stabilise, making disciplined investing, balanced allocation, and a long-term perspective essential during periods of market stress. To learn more about investing and diversification login to Grip Invest today and stay updated.
FAQs On NIFTY 50 Crash
Author: Grip Invest Editorial Team The Grip Invest Editorial Team is a group of Chartered Accountants, MBA (Finance) graduates, and Qualified Research Analysts dedicated to helping you invest smarter. We dive deep into India's fixed income landscape to deliver content that is accurate, up-to-date, and easy to understand. Whether you're exploring bonds, fixed deposits, or other fixed income opportunities, our guides cut through the noise and give you the clarity to make better financial decisions. |
Want to stay at the top of your finances?
Join the community of 4 lakh+ investors and learn more about Grip Invest, the latest financial knick-knacks, and shenanigans in the world of investing.
Happy Investing!
Disclaimer - Investments in debt securities/municipal debt securities/securitised debt instruments are subject to risks including delay and/ or default in payment. Read all the offer related documents carefully. The investor is requested to take into consideration all the risk factors before the commencement of trading.
This communication is prepared by Grip Broking Private Limited (bearing SEBI Registration No. INZ000312836 and NSE ID 90319) and/or its affiliate/ group company(ies) (together referred to as “Grip”) and the contents of this disclaimer are applicable to this document and any and all written or oral communication(s) made by Grip or its directors, employees, associates, representatives and agents. This communication does not constitute advice relating to investing or otherwise dealing in securities and is not an offer or solicitation for the purchase or sale of any securities. Grip does not guarantee or assure any return on investments and accepts no liability for consequences of any actions taken based on the information provided. For more details, please visit www.gripinvest.in
Registered Address - 106, II F, New Asiatic Building, H Block, Connaught Place, New Delhi 110001


