
P/E Ratio Explained: What It Means, Formula And How To Use It For Stock Investing


Here are many methods for determining if a corporation's stock is fairly valued, either at present or in the longer term. One of the most widely used methods for this evaluation is the price to-earnings or P/E ratio.
The P/E ratio tells you how much you are willing to pay per year for every rupee of a corporation's earnings. In this way, it allows you to compare different corporations and understand what other investors think of a stock without needing to read extensive analyses.
When you have a good feeling for how to use the P/E Ratio, you are better prepared to make wise investment decisions when the stock market is volatile. Let's take a closer look at how to evaluate the P/E Ratio in the most accurate and understandable manner possible.
What Is The P/E Ratio?
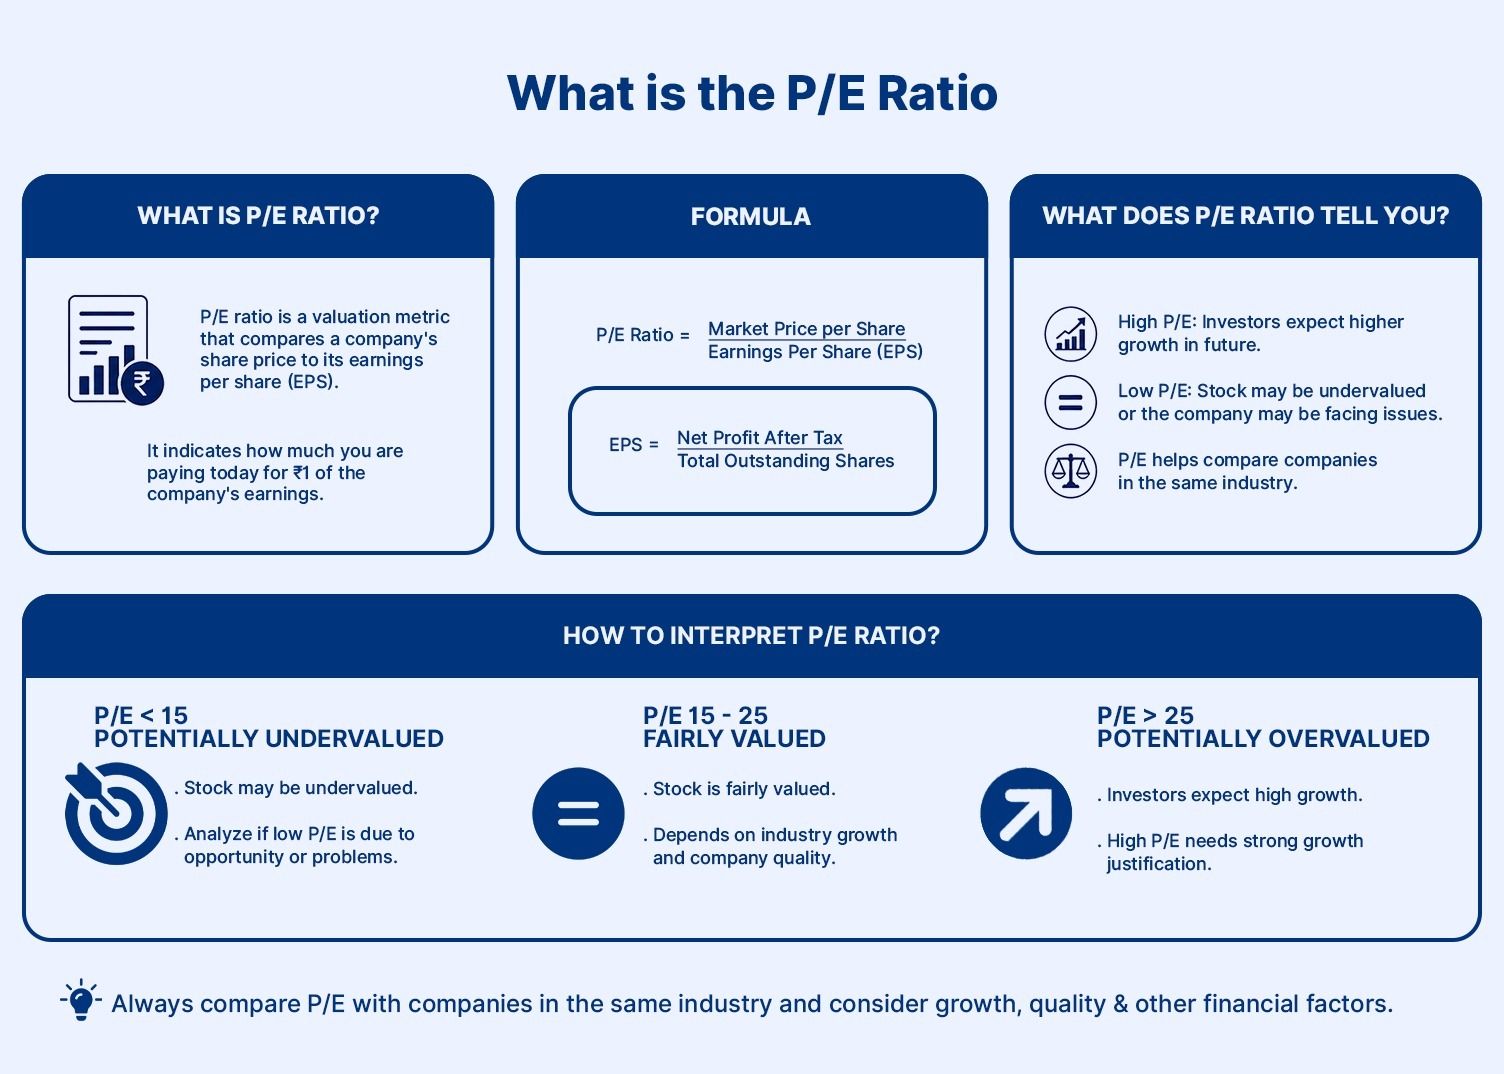
The relationship of a company's share price to the company's earnings per share is what the P/E ratio accomplishes.
For every rupee invested in that company, the P/E ratio will help you understand how long, at the current earnings rate, it will take to recover your investment. A company with a high P/E ratio suggests to investors that it might have future growth potential. Similarly, a low P/E ratio may indicate that the stock is currently undervalued, or that it may be facing some short-term pressures.
However, you should not determine the investment characteristics of a P/E ratio by the number alone. You should always include other factors such as the company's industry, current growth phase, and overall market conditions in your calculations.
PE Ratio Formula :
The PE ratio formula is quite easy to understand.
P/E Ratio Formula: Price per Share ÷ Earnings per Share
Earnings per share are calculated by taking the total profits of a company and dividing them by the number of shares outstanding. You can find this information in either a quarterly or annual financial report.

Hypothetical Example:
A company has a share price of INR 300 and earnings for the year of INR 20. Therefore, it has a price to earnings ratio of 15. In this example, an investor pays INR 15 for every INR 1 of current earnings. The P/E ratio formula is also an effective tool for quickly comparing companies within a specific industry. When doing so, always use the same period of time to obtain complete and fair comparisons.
Types Of P/E Ratios
The P/E ratio has several variations that are used for different purposes. Understanding the various types of P/E ratios will assist you in making the correct decision as to which type to review.
- Trailing P/E vs Forward P/E
Comparing trailing PE vs forward PE ratios is beneficial. The trailing P/E ratio uses the results of the past twelve months as opposed to the forward P/E ratio, which uses the projected results of future earnings. Because the trailing P/E ratio is based on actual results, it has the advantages of being factual and objective.
The forward P/E ratio, however, is based on what analysts expect for the company's growth; as such, it is speculative and subject to error. Comparing projected earnings with actual earnings gives both trailing and forward P/E ratios different interpretations of value. For this reason, many investors review both types of P/E ratios to help them better understand their investment opportunities. - Absolute P/E vs Relative P/E
Absolute P/E is the simple number calculated for one company. Relative P/E compares the current ratio with the company’s historical average or industry peers. This context makes the analysis more meaningful.
What Is A Good PE Ratio India (Sector Benchmarks)?
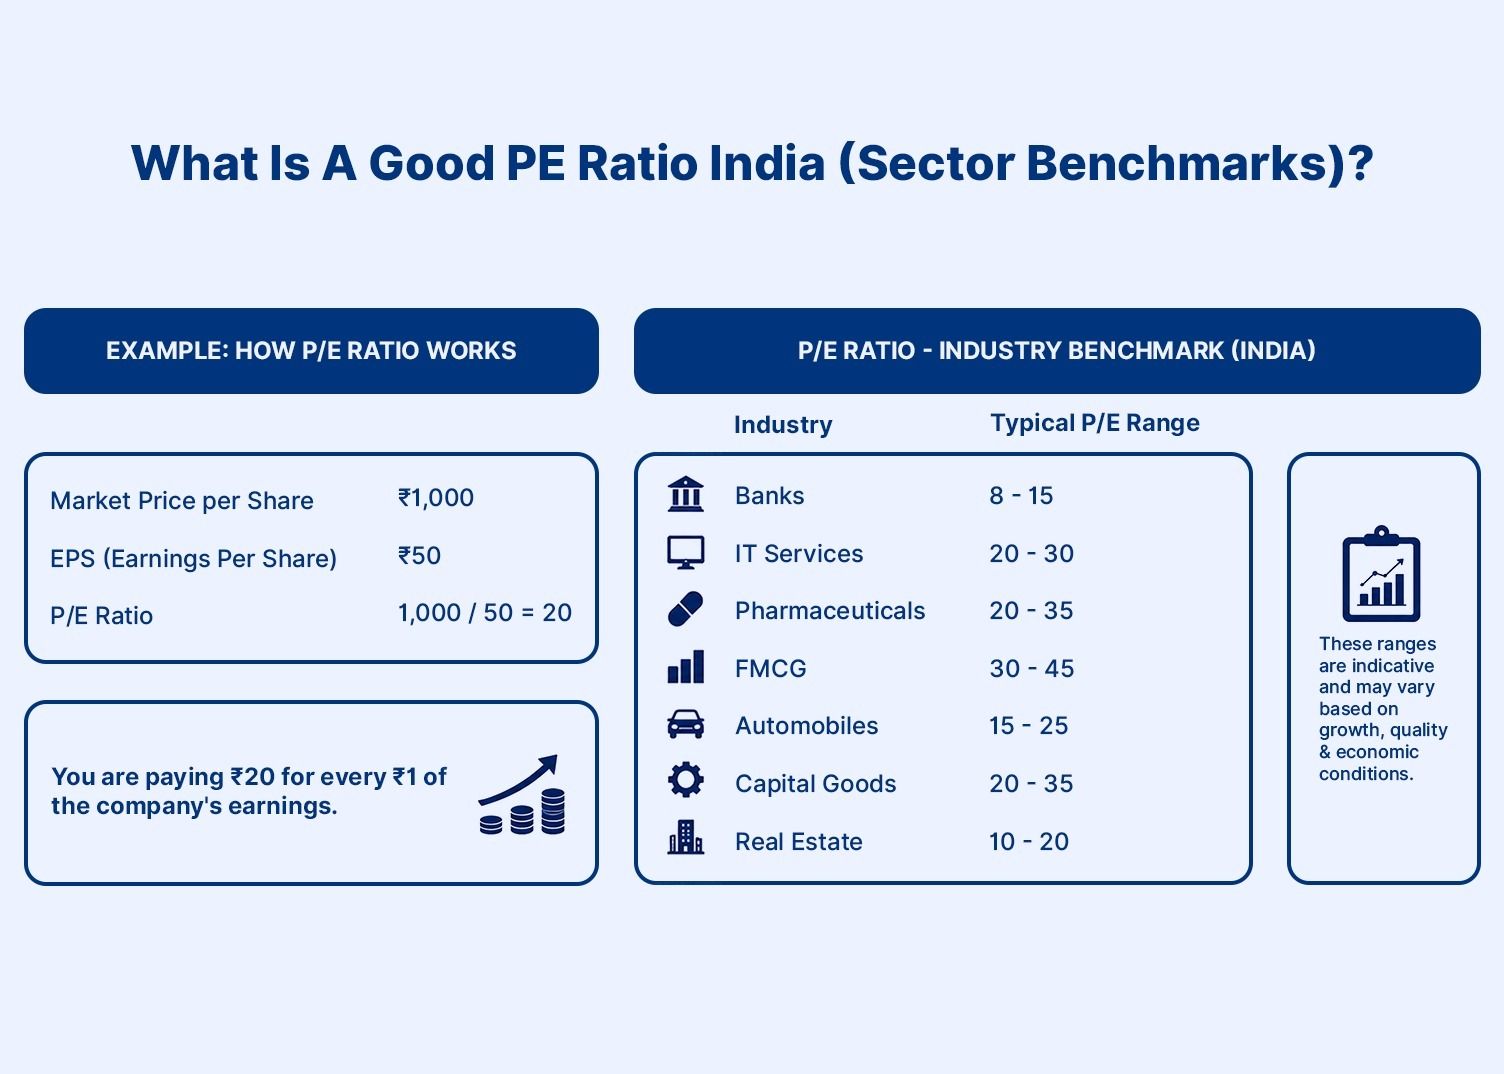
The Stamp of India has no single number like an ideal P/E ratio. An ideal P/E will differ by sector. Some sectors are defensive (such as Food & Beverage) and tend to be assigned higher P/Es. While other sectors that are cyclical in nature (such as automotive, metals, etc.) will typically be assigned much lower P/Es.
The Nifty has a P/E of roughly 21 today, indicating the overall Indian stock market is trading at a medium level of value.
Hypothetical Example:
A bank has a P/E of 12. If the average bank in India has a P/E of 8, then the bank will appear attractive relative to all banks in India. If an FMCG company has a P/E change of 40 and its average change is also 40, we can say the bank is attractive. The FMCG company is fine as long as it continues to show consistent growth.
Limitations Of The P/E Ratio
The P/E multiple has some significant limitations that should be understood before relying on it for investment decisions. If a company has not turned a profit yet or has negative earnings, the P/E will be meaningless. Loss making businesses have a P/E. A lower amount of debt than other comparable companies results in a high average leverage ratio. However, many companies will have a mix of low, negative or no consistency from cash flows and low ratios, while others will have high, positive and consistent earnings.
Furthermore, two companies with the same P/E may be in completely different financial positions, making one company a great investment and another a poor investment based on the other´s metrics or ratios.
The P/E will also frequently be inaccurate in predicting the future of an investor if earnings have fluctuated highly. Therefore, the most accurate possible method for making investment decisions will always combine the P/E with other metrics. Relying solely on the P/E is likely to lead to bad investment decisions.
P/E Ratio vs P/B Ratio vs EV/EBITDA
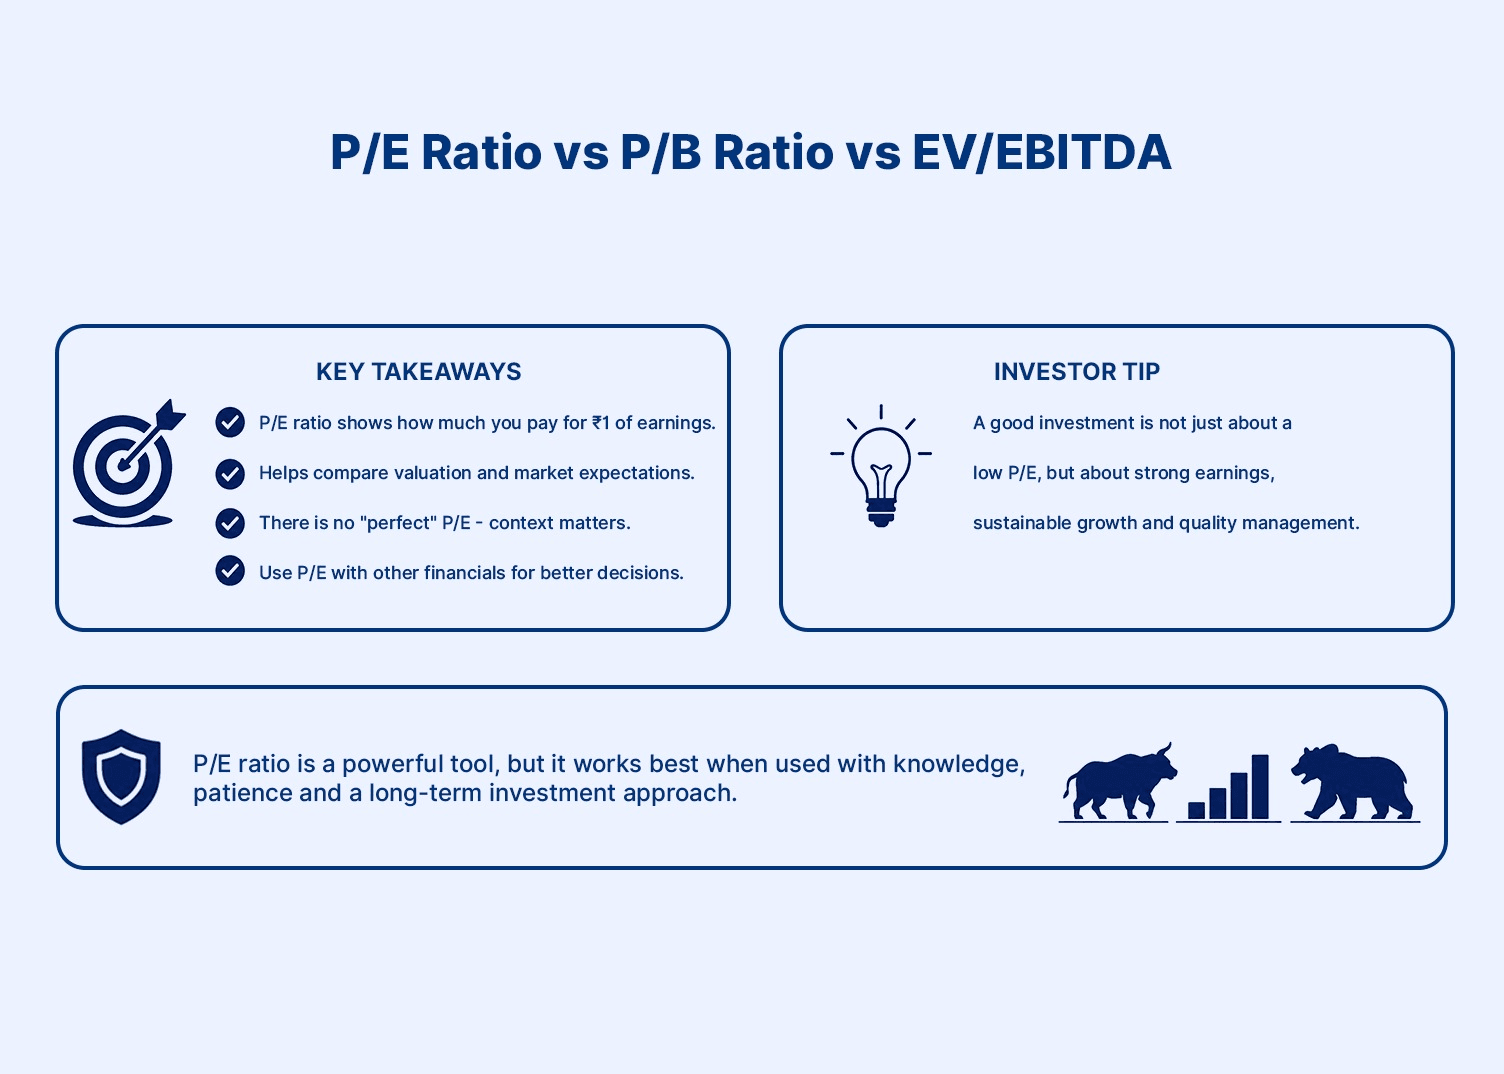
The three primary methods for measuring value have similar uses.
For example, a P/E ratio measures earnings, while a P/B ratio measures an entity’s net asset value also referred to as "book value". An EV/EBITDA ratio generally measures total corporate value based on operating income before interest, taxes, and depreciation. The EV/EBITDA ratio can therefore be useful to compare companies using different forms of leveraged debt to fund operations.
A common reason that P/E ratios remain so popular among investors is that they are straightforward. In addition, by applying the P/E ratio formula correctly, you will become a more advanced analyst.
The P/E ratio in India may differ from that in other places due to factors such as unique market characteristics, investor perceptions about potential future growth, and the overall economic environment in India. The Nifty index provides an excellent means for assessing overall investor sentiment toward the market.
There is additional value for investors who examine their analyses using both trailing P/E ratios and forward P/E ratios at the same time, as this comparison generates additional ideas about an appropriate entry or exit point on any specific stock or security.
Additional Important Points
When you look at the combination of P/E and return on equity (ROE), this provides additional context to help you assess the quality of the company.
If you have a decent P/E ratio and high ROE, this usually means there is sufficient strength in the business. The business cycle has a huge impact on the ratios. Ratios tend to expand during the bullish phase of the market and contract during the bearish phase. Therefore, comparing your company's ratio with its historical averages within its duces provides a meaningful comparison.
Conclusion
The P/E ratio is a good starting point for performing stock research; the price-to-earnings ratio will provide the guidance you need if you use it correctly. Reading and understanding the specific details on P/E ratios in India, as well as the historical trend of the Nifty P/E, will enhance your investment methodology. You will improve your confidence over time as you practice using trailing P/E versus the forward P/E. Lastly, remember that ratios are tools, not definite answers.
They should be used along with deeper analysis, an understanding of the industry, and most importantly, patience. Using this method, you will achieve superior long-term results when investing in the Indian stock market.
FAQ: About The P/E Ratio
Author: Grip Invest Editorial Team The Grip Invest Editorial Team is a group of Chartered Accountants, MBA (Finance) graduates, and Qualified Research Analysts dedicated to helping you invest smarter. We dive deep into India's fixed income landscape to deliver content that is accurate, up-to-date, and easy to understand. Whether you're exploring bonds, fixed deposits, or other fixed income opportunities, our guides cut through the noise and give you the clarity to make better financial decisions. |
Want to stay at the top of your finances?
Join the community of 4 lakh+ investors and learn more about Grip Invest, the latest financial knick-knacks, and shenanigans in the world of investing.
Happy Investing!
Disclaimer - Investments in debt securities/municipal debt securities/securitised debt instruments are subject to risks including delay and/ or default in payment. Read all the offer related documents carefully. The investor is requested to take into consideration all the risk factors before the commencement of trading.
This communication is prepared by Grip Broking Private Limited (bearing SEBI Registration No. INZ000312836 and NSE ID 90319) and/or its affiliate/ group company(ies) (together referred to as “Grip”) and the contents of this disclaimer are applicable to this document and any and all written or oral communication(s) made by Grip or its directors, employees, associates, representatives and agents. This communication does not constitute advice relating to investing or otherwise dealing in securities and is not an offer or solicitation for the purchase or sale of any securities. Grip does not guarantee or assure any return on investments and accepts no liability for consequences of any actions taken based on the information provided. For more details, please visit www.gripinvest.in
Registered Address - 106, II F, New Asiatic Building, H Block, Connaught Place, New Delhi 110001


