

Technical Indicators: Types, Examples And How Traders Use Them


Trading in volatile markets can be daunting because prices are unpredictable and change frequently from day to day. Traders can utilise technical indicators to help them identify the best time to buy or sell stocks.
These indicators are terrific tools for novice and experienced traders when analysing market activity through stock market indicators in India.
What Are Technical Indicators?
Technical indicators are visually based mathematical tools, which are often overlaid onto a price chart. These indicators help a trader identify hidden trends in a market without knowing anything about company news, earnings or other events that may affect that stock's price.
It changes raw price and volume data into lines, bars or signals that a trader can quickly understand and use to make decisions. So, technical indicators are extremely popular when trading stocks in the Indian stock market, because they can help you predict short-term stock price movement.
Types of Technical Indicators
Because the behaviour of financial markets varies widely, technical indicators are divided into several categories so that you can gain targeted insight into trends within various financial instrument markets.
1. Trend Indicators
Trend Indicators are price-smoothing systems used to detect overall market movement: up, down, or sideways. They discern movement's strength, thereby enabling traders to enter movements as early as possible.
For example, when the price of a security rises above its moving average, it signals to a trader that he should buy in a continuously rising trend.
2. Momentum Indicators
Momentum Indicators are systems that gauge the velocity and magnitude of price movements to identify potential reversal opportunities through overbought or oversold periods. Momentum indicators are oscillators, thus, they determine when trader enthusiasm is at a peak or a trough.
For example, an indicator that moves rapidly and reaches an extreme high suggests to traders that the time is right to start selling.
3. Volume Indicators
Volume Indicators monitor the number of trades associated with price movement in order to confirm the conviction behind the trade. High volume trades are strong indicators of trend activity, while low volume trades indicate low trend activity.
For example, when the price of a stock rises, and the volume numbers increase along with it, this indicates strong bullish support.
4. Volatility Indicators
Volatility Indicators determine the ranges that a security will swing within over time. In addition to defining a range, volatility indicators also give a trader the ability to anticipate whether the range will be wide or narrow. Bollinger
For example, narrow Bollinger Bands generally signal the impending presence of a breakout opportunity for traders.
Popular Technical Indicators Explained
Numerous indicators exist, but some are more useful as everyday traders due to their reliability regardless of the financial instrument being traded. Start with the few below, then gradually add more.
1. RSI Indicator Meaning
The relative strength index indicates if the price is being pushed too high or low based on the last 0-100, where anything above 70 indicates the market is overbought and anything below 30 indicates the market is oversold.
This is done by comparing the last few periods' gains to the last few periods' losses. It is common to identify dips below 30 and buy those dips before they bounce back. For example, if a stock market price drops, the RSI will drop, indicating to an experienced trader that the stock should be bought prior to the stock's bounce back.
2. MACD Explained
The MACD shows a difference between two moving averages plotted against a signal line to help identify trends changing directions visually, as well as momentum changes.
When the MACD crosses above the signal line, the traders will reliably buy. When it crosses below, they will reliably sell. The bars on the histogram show how strong or weak the momentum is. For example, an MACD cross through the signal line will provide a 10% profit shortly after that point.
3. Moving Averages
Moving averages serve as support lines to average a stock price over time to identify trend lines. They uniformly apply across the time frame being measured in simple averages versus exponentially weighting the last few periods of time.
A golden cross occurs when a short-term moving average crosses over a long-term moving average. For example, if a stock is bouncing off its 50-day point on multiple occasions, it will inspire the trader to stay long with that stock.
4. Bollinger Bands
Bollinger Bands are a way to measure price volatility within an average, creating a band to represent the expected range of price movement. Price action can compel as much as they create potential volatility as the bands contract, leading to significant price movement.
The higher band may suggest there could be a sell for an uptrend, while the lower band could suggest a buy. The average could provide dynamic support, no matter whether the price is increasing or decreasing.
Limitations Of Technical Indicators
Even though there are a lot of ways to represent technical indicators, they are late to the party. Technical indicators rely on historical data to predict future stock movements and tend to be wrong. The result is often confusion due to false technical signals that occur from fluctuations or inconsistencies in price action.
A single technical indicator alone is not enough to provide confirmation. This should also consider the overall economic conditions; this creates a risk management scenario for trading successfully, since back testing results of success rates around 50 to 60 percent.
Hypothetical Example:
A trader entered into a perfect buying position using RSI, but the trade was negatively affected because of a circuit breaker versus a buy-and-hold strategy until the stock went lower than its original value.
Should Long-Term Investors Use Technical Indicators?
As with any fundamental type of investing, long-term investors consider technical indicators. However, technical indicators will assist long-term investors with timing both the purchase and/or the sale of a stock once it reaches its fundamental value.
Therefore, while long-term investors will utilise trends to continue putting money into a stock when prices are low on average, traders looking for short-term gains should also use technical indicators.
Combining Indicators For Better Results
Use trend & momentum layering, confirmation, to reduce whipsaws. Volume validating breakout for conviction behind moves. Volatility flags alert when to be patient in the choppy market.
Paper trading helps gradually develop an instinctive feel. Indian stock market indicators work well with regular free charting programs.
Best Practices For Beginners
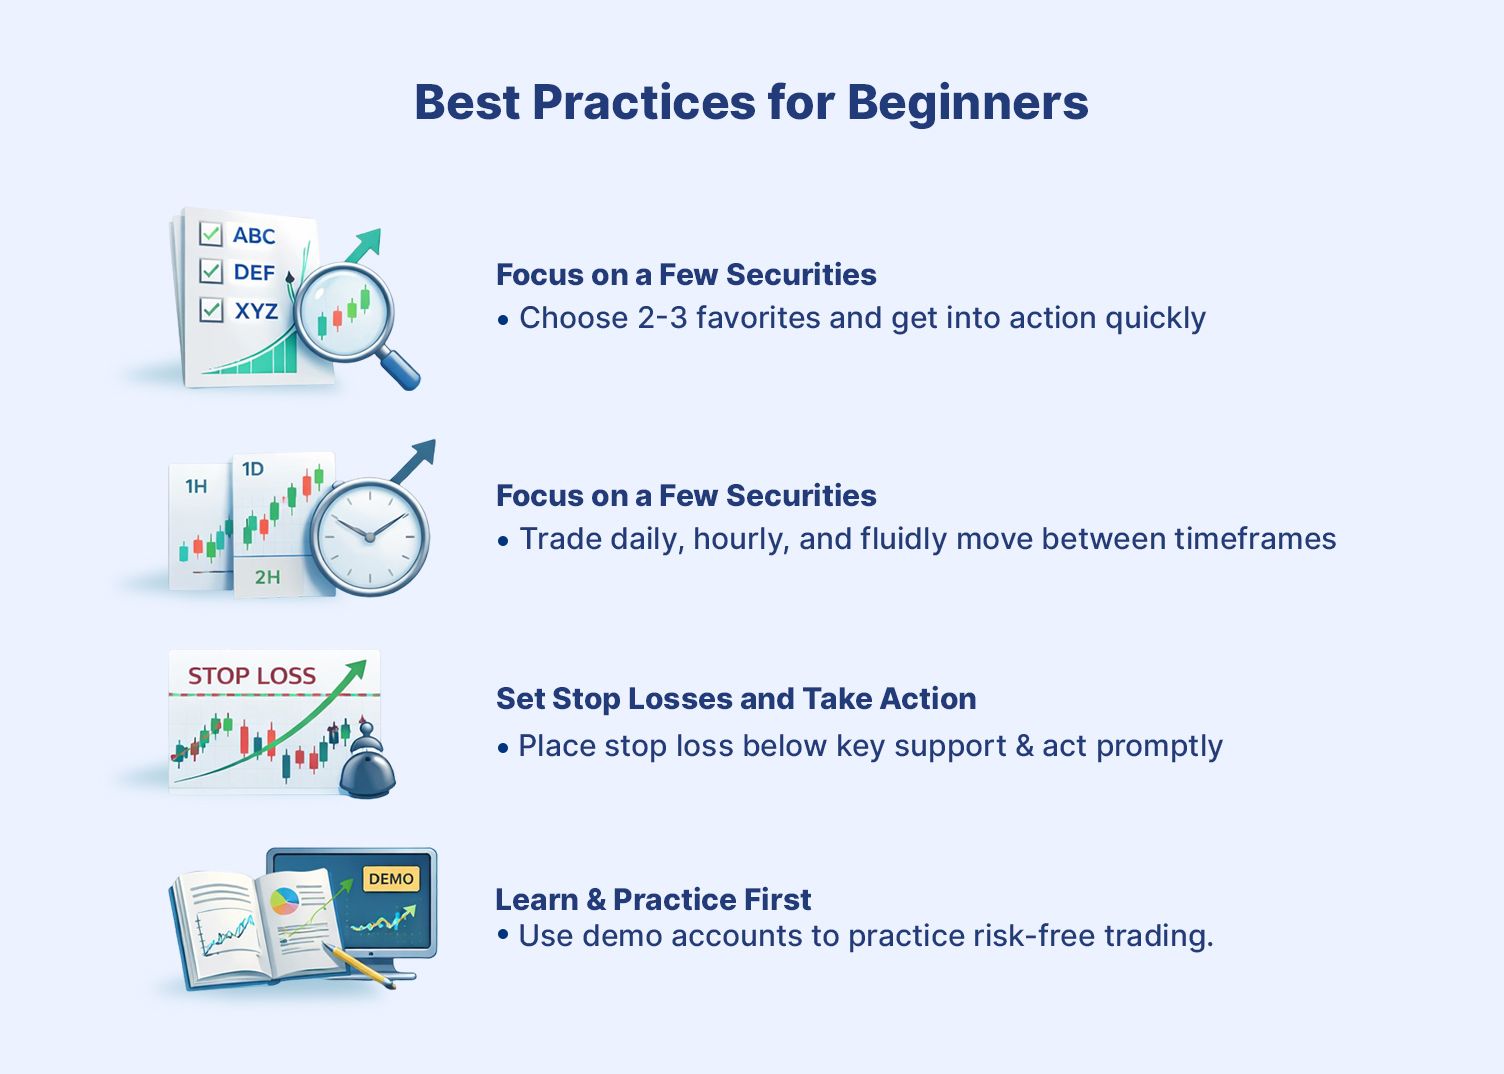
- Choose a few (2 to 3) of your favourite securities and do not let overload or paralysis stop you from getting action quickly.
- Timeframes should be used in multiple increments from daily, to hourly, to trade fluidly.
- Make a habit of placing your stop loss below key support & act on it with complete faith.
- Journal all of your trades, linking the signals from your indicators with the outcomes you've learned.
- Use demo accounts to try out no-risk trades before paper trading.
Conclusion
Technical indicators give traders structure in markets that often feel chaotic. Whether it’s understanding RSI indicator meaning to spot overbought zones, using MACD to confirm momentum shifts, or applying a moving average strategy to follow trends, these tools help turn raw price data into actionable insight. The key is not relying on one signal, but combining indicators with risk management and discipline.
At the same time, short-term trading is only one part of the larger investing landscape. While traders focus on stock market indicators in India for timing entries and exits, long-term investors often prioritise steady income and capital preservation alongside growth.
That’s where platforms like Grip Invest come in. While technical indicators help you navigate equity markets, Grip Invest offers access to fixed-income opportunities that can balance a portfolio with predictable returns. Used thoughtfully, both approaches can coexist — one for tactical market moves, the other for building stable, long-term wealth.
FAQs On Technical Indicators
1. What technical indicator is the best?
There is not one single indicator that will rule dominantly over the others. The combination of several of the indicators, such as RSI, MACD & moving averages, typically can provide a combined win percentage above 60% through validation.
2. Can RSI be an ideal indicator for new traders to start with?
Yes, The RSI can help you with clear signals for overbought and oversold conditions. This will certainly make it easy to use and understand without doing complex maths.
3. Can indicators be used to predict stock prices?
Indicators signal probabilities based on historical pattern repetition, but they will never be an absolute guarantee due to changing sentiments or news events occurring that would drastically change outlooks.
Want to stay at the top of your finances?
Join the community of 4 lakh+ investors and learn more about Grip Invest, the latest financial knick-knacks, and shenanigans in the world of investing.
Happy Investing!
Disclaimer - Investments in debt securities/municipal debt securities/securitised debt instruments are subject to risks including delay and/ or default in payment. Read all the offer related documents carefully. The investor is requested to take into consideration all the risk factors before the commencement of trading.
This communication is prepared by Grip Broking Private Limited (bearing SEBI Registration No. INZ000312836 and NSE ID 90319) and/or its affiliate/ group company(ies) (together referred to as “Grip”) and the contents of this disclaimer are applicable to this document and any and all written or oral communication(s) made by Grip or its directors, employees, associates, representatives and agents. This communication does not constitute advice relating to investing or otherwise dealing in securities and is not an offer or solicitation for the purchase or sale of any securities. Grip does not guarantee or assure any return on investments and accepts no liability for consequences of any actions taken based on the information provided. For more details, please visit www.gripinvest.in
Registered Address - 106, II F, New Asiatic Building, H Block, Connaught Place, New Delhi 110001


