

Corporate Bond Valuation: Investor’s Guide to Fair Value and YTM In India


Indian companies raised INR 9,11,078 crore through debt issues during FY26. Of this, private placements accounted for INR 8,99,736 crore, while public debt issues contributed INR 11,343 crore.
This scale shows how important corporate bonds have become as a funding tool. Companies use them to raise money for expansion, new projects, working capital and other business needs.
For investors, however, a bond is not just about its coupon rate or quoted price. They must also assess whether the return fairly compensates for the risks involved.
Corporate bonds work differently from shares. When you buy one, you do not become an owner of the company. You become a lender, and the company agrees to pay interest and repay the principal under the stated terms.
That promise depends heavily on the issuer’s financial health. If the company’s financial position weakens, the bond’s value and expected returns may come under pressure.
Several factors must therefore be considered before investing in corporate bonds in India. A systematic evaluation process becomes essential.
Corporate Bond Valuation forms the foundation of such informed decisions. This article aims to help you navigate this process, equipping you with the essential knowledge needed for buying corporate bonds.
What Is Corporate Bond Valuation?
At its core, Corporate Bond Valuation answers this question- ‘what are the bond’s future payments worth today?’
It estimates the present value of the payments an investor expects to receive from a bond.
These payments generally include:
- periodic coupon payments;
- repayment of the face value at maturity;
- any additional payment specified in the bond terms.
However, future payments do not carry the same value as received today. Inflation, investment opportunities and the risk of delayed payments can reduce its present worth.
Investors therefore discount each future payment using a rate that reflects current market yields and the bond’s risks. Adding these discounted payments gives the estimated fair value of the bond.
Unlike stocks, these instruments offer fixed returns but carry the risk of default. To account for this, investors apply a discount rate that reflects the issuer’s credit risk. Additionally, in the event of default, the percentage of the bond's value recovered - known as the payout ratio - affects its assessment. This valuation of corporate bonds helps investors decide if the bond’s current price aligns with its risk and return profile.
How To Value A Corporate Bond?
Valuing a corporate bond means estimating what its future payments are worth today. Investors can do this by following a few key steps.
1. Estimate the Expected Cash Flows
Start by identifying the bond’s periodic coupon payments and the principal repayment due at maturity.
For example, a bond with an INR 1000 face value and a 5% annual coupon will pay INR 50 each year. The issuer will also repay the INR 1000 principal at maturity, provided it meets its obligations.
2. Consider the Issuer’s Default Risk
A corporate issuer may fail to make the promised interest or principal payments. Investors must therefore assess its credit rating, financial condition and repayment capacity.
A higher probability of default can reduce the value investors are willing to assign to the bond. However, default probability alone does not show the expected loss. The amount that may be recovered also matters.
3. Apply an Appropriate Discount Rate
Choose a discount rate that reflects prevailing market yields and the risks associated with the bond.
Investors generally use a higher required yield for issuers with weaker credit profiles. This higher discount rate reduces the present value of the bond’s future payments.
The rate may also reflect the bond’s tenure, liquidity and call or put features.
4. Calculate the Bond’s Present Value
Discount each coupon payment and the principal repayment to determine what they are worth today.
The formula is:

The coupon payment, yield and number of periods must follow the same frequency. For a semi-annual bond, investors must use half-yearly coupon payments and a half-yearly discount rate.
5. Consider Expected Recovery
If the issuer defaults, investors may still recover part of their investment through collateral, restructuring or insolvency proceedings.
This is known as the recovery rate. A higher expected recovery can reduce the potential loss, while a lower recovery may weaken the bond’s estimated value.
6. Add the Present Values
Add the present value of every coupon payment and the principal repayment.
The result provides the bond’s estimated fair value based on the selected yield and payment assumptions. Investors can then compare it with the available market price.
By following the above steps, investors can determine the true worth of a corporate bond, weighing its potential returns against the risks involved. But remember, this valuation is an estimate rather than a fixed figure. Factors like, changes in market yields, credit quality or liquidity can alter the bond’s value.
Here are several factors can change a bond’s required yield and present value.
1. Coupon Rate
The coupon rate determines the periodic interest payment. A bond offering a coupon above prevailing market yields may trade at a premium.
A lower coupon can result in a discount.
2. Prevailing Interest Rates
Existing bond prices generally fall when market interest rates rise. New bonds may then offer higher coupons or yields, making older low-coupon bonds less attractive.
The reverse occurs when market yields fall.
3. Credit Quality
A deterioration in the issuer’s repayment capacity can increase the required return. The bond’s price may consequently decline.
An improvement in credit quality may reduce the required yield and support its valuation.
4. Remaining Tenure
Longer-tenure bonds usually react more strongly to interest-rate movements because their cash flows extend further into the future.
The final effect also depends on the coupon rate, payment schedule and yield.
5. Liquidity
A listed bond may still have limited trading activity. Investors may demand a higher yield when they expect difficulty selling the instrument before maturity.
SEBI notes that listing does not guarantee the development of a liquid secondary market.
6. Security and Covenants
A secured bond may provide a claim over identified assets. However, its protection depends on the quality of the collateral, security cover, charge ranking and enforcement process.
Covenants can restrict additional borrowing, asset sales or other actions that might weaken bondholders’ position.
7. Call and Put Options
A callable bond allows the issuer to redeem it before maturity under specified terms. This can limit gains when interest rates fall and create reinvestment risk.
A put option gives investors the right to seek repayment on a predetermined date.
Together, these factors can cause a bond’s estimated value to differ from its quoted market price. Investors should therefore understand the difference between the fair value vs. market value of a bond.
Market value is the price at which the bond currently trades or is available for purchase. Fair value estimates what the bond should be worth based on its cash flows, required yield, credit risk and prevailing market conditions.
Corporate Bond Yields
This indicates the return an investor can expect, including interest payments and the repayment of the initial amount at maturity. Corporate securities often provide higher yields because investors are compensated for taking on the issuer's credit risk, unlike the more stable returns of government bonds.
How To Calculate A Corporate Bond’s Yield?
Current Yield
Current yield compares the annual coupon payment with the bond’s current market price.
Current yield = (Annual coupon payment / Market price) x 100
Suppose the same bond pays INR 90 annually but trades at INR 950:
Current yield = (90 / 950) x 100 = 9.47%
This gives a clearer view of the income earned at the current price. However, it still leaves out the remaining tenure and any gain or loss when the principal is repaid.
Yield to Maturity brings these elements together.
Yield to Maturity
Yield to Maturity, or YTM, estimates the annualised return when an investor buys a bond at its current price and holds it until maturity.
It considers:
- coupon payments;
- purchase price;
- face value repaid at maturity;
- time remaining to maturity;
- coupon frequency.
YTM is the discount rate that makes the present value of the bond’s future payments equal to its current price.
A simple approximation is:
Approximate YTM = [Annual coupon + (Face value - Price) / Years to maturity] / [(Face value + Price) / 2] x 100
Consider a bond with:
- annual coupon payment: INR 90;
- market price: INR 950;
- face value: INR 1000;
- remaining tenure: three years.
The approximate YTM is:
Approximate YTM = [90 + (1000 - 950) / 3] / [(1000 + 950) / 2] x 100
Approximate YTM = 10.94%
The exact YTM is approximately 11.05%. The small difference arises because the approximation does not fully account for the timing and compounding of each payment.
The bond price equation can be represented as:
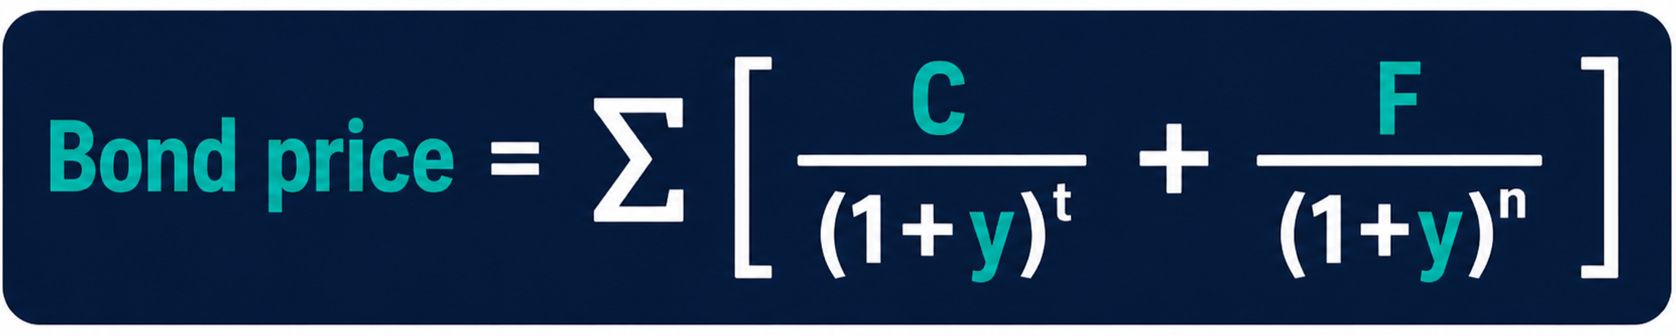
Where:
- C is the coupon payment per period;
- y is the YTM per payment period;
- t represents each payment period;
- F is the face or redemption value;
- n is the total number of periods remaining.
The coupon, yield and number of periods must use the same payment frequency. For a semi-annual bond, investors must use half-yearly figures.
YTM assumes that the issuer makes all scheduled payments and that coupons can be reinvested at the same yield. Actual returns may therefore differ.
Using Excel
Exact YTM can be difficult to calculate manually because it requires solving for the discount rate. Investors can instead use Excel’s YIELD function.
The syntax is:
YIELD(settlement, maturity, rate, price, redemption, frequency, basis)
The function considers the settlement date, maturity date, coupon rate, clean price, redemption value, payment frequency and day-count convention.
YTM relies on discounting future coupon and principal payments. To understand why this adjustment is necessary, it helps to first understand the time value of money.
Why Is the Time Value of Money Important?
The Time Value of Money (TVM) meaning refers to the principle that money available today is generally worth more than the same amount received later.
Corporate bonds make payments on different future dates. Investors therefore need to convert these coupon and principal payments into their present value before estimating what the bond is worth today.
1. Inflation Reduces Purchasing Power
Inflation reduces what money can buy over time.
For example, INR 1000 received several years later may purchase fewer goods and services than INR 1000 today. The longer the investor must wait, the greater the possible effect on purchasing power.
2. Future Payments Carry Uncertainty
A company’s financial condition may change before the bond matures. Weak cash flow, higher debt or business disruption can affect its ability to meet scheduled payments.
Investors generally demand a higher return when this uncertainty increases. The higher discount rate then reduces the present value of the bond.
3. Money Has an Opportunity Cost
Money available today can be invested elsewhere and earn a return.
Waiting for a future bond payment means giving up that opportunity. The return available from comparable investments therefore influences the rate used to discount the bond’s future payments.
TVM Example
Suppose a bond will pay INR 1,000 after three years. If the appropriate annual discount rate is 8%:
Present value = INR 1,000 ÷ (1.08)³
Present value = INR 793.83
The investor will still receive INR 1,000 after three years. However, that future payment is worth about INR 793.83 today when discounted at 8%.
This present-value adjustment forms the basis of bond pricing. The next step is understanding how changes in the required yield affect that value.
Role Of Yields in Bond Valuation
Yield acts as the rate used to discount the bond’s future coupon and principal payments.
When the required yield rises, future payments are discounted more heavily. The bond’s present value falls.
When the required yield declines, the discount becomes smaller. The bond’s value rises.
Change in required yield | Likely effect on bond price |
Yield rises | Price falls |
Yield falls | Price rises |
Yield equals coupon rate | Price may remain near face value |
Yield exceeds coupon rate | Bond may trade below face value |
Yield is below coupon rate | Bond may trade above face value |
The yield required by investors can reflect prevailing interest rates, remaining tenure, liquidity and the issuer’s credit quality.
The credit spread in bonds forms part of this required return. It refers to the additional yield offered by a corporate bond over a government security with a similar maturity.
For example, if a five-year government security yields 7% and a similar corporate bond yields 8.5%, the credit spread is 1.5%, or 150 basis points.
A wider spread may reflect higher perceived credit risk or lower liquidity. Since it increases the required yield, it generally reduces the bond’s value.
Yield also helps investors compare bonds with different coupons and prices. A high coupon does not always produce a higher return, particularly when the bond trades at a premium.
7 Steps In Evaluating A Corporate Bond Issuer
While calculating yield is important, it’s only part of the picture. A deeper analysis of the company’s financial health is crucial to understand the bond’s true potential. Here are steps to assess the strength of a corporate bond issuer and reduce risks:
1. Evaluate Financial Statements: The first step in assessing an issuer is to analyse their financial statements. Reviewing the company's balance sheet, income statement, and cash flow statement allows investors to understand the issuer's financial position, profitability, and liquidity. Key metrics such as debt levels, revenue growth, and interest coverage ratio should be scrutinised to assess the issuer's ability to service its debt obligations.
2. Credit Rating Analysis: Credit ratings assigned by reputable credit rating agencies offer valuable insights into an issuer's creditworthiness. These ratings reflect the agency's assessment of the issuer's ability to repay its debt. Investors should consider the investment grade credit rating for buying Corporate Bonds and evaluate any changes or trends in the rating over time. It is important to note that credit ratings are not infallible, and investors should supplement this analysis with other due diligence measures.
3. Industry and Market Outlook: Understanding the issuer's industry and the broader market conditions is essential. Evaluate the industry's growth prospects, competitive landscape, and regulatory environment. Factors such as market share, barriers to entry, and technological disruptions can significantly impact an issuer's performance. Additionally, consider macroeconomic indicators, interest rate movements, and the overall investment climate to assess the market's impact on the issuer's financial stability.
4. Management Evaluation: The competence and integrity of an issuer's management team play a vital role in determining its long-term prospects. Evaluate the management's track record, experience, and ability to navigate challenges. Consider factors such as corporate governance practices, succession planning, and alignment of management's interests with those of the investors. Transparent and ethical management practices are indicative of a well-managed company.
5. Debt Structure and Covenants: Analyse the issuer's debt structure and covenants associated with the bonds. Evaluate the debt maturity profile, interest rate risk, and any refinancing risks that may arise in the future. Scrutinise the covenants in the bond documentation to understand the issuer's obligations, restrictions, and potential events of default. Assessing the issuer's ability to meet these obligations is crucial for mitigating risk.
6. Cash Flow Analysis: Evaluating an issuer's cash flow generation is vital for assessing its ability to service debt obligations. Study the cash flow from operations, investing activities, and financing activities.
A healthy and consistent cash flow indicates that the issuer has sufficient funds to meet interest payments and repay principal amounts. Additionally, consider the issuer's working capital management and ability to generate free cash flow.
7. Legal and Regulatory Considerations: Understand the legal and regulatory environment within which the issuer operates. Evaluate any pending litigation, regulatory compliance issues, or legal disputes that may impact the issuer's financial stability.
To summarise, when you invest in Corporate Bonds, you need to ensure the company is in a position to repay your principal and the interest due to you.
You need not be bogged down by the huge data provided in the annual reports. Some ratios listed below can be used to do the analysis. These ratios are simple to understand and sufficient to have a fair idea of the capacity of the company to repay your dues.
Ratios That Help In Corporate Bond Valuation
Financial ratios do not enter directly into the bond-pricing formula. However, they help investors assess credit risk, which can influence the required yield and estimated value of the bond.
The following table covers some of the ratios commonly reviewed during corporate bond valuation.
| Ratio | Basic formula | What it signifies |
| Interest Coverage Ratio | Operating earnings / Interest and finance charges | Whether operating earnings can comfortably cover interest costs |
| Debt-to-Equity Ratio | Total debt / Shareholders’ equity | How heavily the company relies on borrowed funds |
| Debt Service Coverage Ratio | Cash available for debt service / Principal and interest due | Whether cash generation is sufficient to meet total debt payments |
| Current Ratio | Current assets / Current liabilities | The company’s ability to meet short-term obligations |
| Net Cash Accrual to Total Debt | Net cash accrual / Total debt | The company’s ability to reduce debt through internal cash generation |
The Interest Coverage Ratio meaning is direct. It shows the cushion available for paying interest from operating earnings.
A higher ratio generally suggests that the company can manage its finance costs more comfortably. A low or declining ratio may indicate that interest obligations are becoming harder to sustain.
The Debt-to-Equity Ratio meaning in bonds relates to the level of borrowing compared with shareholder funds. A high ratio may indicate greater financial pressure because the company has more fixed repayment obligations.
However, no single ratio gives a complete answer. Acceptable levels vary across sectors, and the figures should always be compared with earlier years and similar companies.
Investors should also review the maturity pattern of existing loans. A company may appear stable today but still face pressure if a large amount of debt falls due within a short period.
Past defaults, repeated refinancing, covenant breaches and legal disputes should also be considered alongside the ratios.
Once the issuer’s repayment strength has been assessed, the next step is to understand the price at which the bond is quoted and the amount actually paid at settlement. These two figures may not always be the same.
Clean Price vs. Dirty Price
A coupon-paying bond may be sold between two coupon payment dates. By then, the seller has already earned part of the next coupon for the period they held the bond.
The buyer compensates the seller for this amount through accrued interest.
The quoted bond price usually excludes this accrued interest. This is known as the clean price. The dirty price includes accrued interest and is closer to the amount paid at settlement.
The relationship is:
Dirty price = Clean price + Accrued interest
Clean Price and Dirty Price Example
Consider a bond with the following details:
- Face value: INR 1,000
- Annual coupon rate: 9%
- Semi-annual coupon payment: INR 45
- Clean price: INR 980
- Days since the previous coupon payment: 60
- Total days in the coupon period: 180
The accrued interest is:
Accrued interest = INR 45 × 60 ÷ 180
Accrued interest = INR 15
The dirty price is therefore:
Dirty price = INR 980 + INR 15
Dirty price = INR 995
The investor sees a quoted clean price of INR 980 but pays INR 995 after including the interest earned by the seller.
The following comparison makes the distinction clearer.
| Parameter | Clean price | Dirty price |
| Accrued interest | Excluded | Included |
| Main purpose | Quoting and comparing bond prices | Calculating the settlement amount |
| Price movement | Mainly reflects changes in yields and credit risk | Also changes as interest accrues |
| Amount paid by the buyer | Does not show the complete amount | Includes the accrued interest payable |
| Immediately after a coupon payment | Usually close to the dirty price | Usually resets towards the clean price |
The actual accrued interest may vary according to the settlement date and day-count convention used for the bond.
Understanding Clean Price vs. Dirty Price prevents investors from mistaking the quoted price for the complete purchase amount. It also makes comparisons between bond valuations and settlement values more accurate.
Step By Step Investor Checklist To Evaluate A Bond
A valuation formula cannot replace complete due diligence. Use the following checklist before investing.
1. Verify the Credit Rating
Check the current rating, outlook, rating rationale and previous changes.
Do not rely only on the rating symbol. Read the reasons supporting the rating and the risks identified by the agency.
2. Examine the Issuer’s Financial Strength
Review revenue, profitability, cash flow, net worth, debt and finance costs.
Check whether the company generates sufficient cash from its core operations.
3. Compare Coupon and YTM
The coupon shows the contractual interest rate. YTM reflects the return based on the purchase price and remaining cash flows.
Compare YTM with bonds of similar tenure and credit quality.
4. Understand the Credit Spread
Compare the bond’s yield with a government security of similar maturity.
A large spread requires further analysis. It may represent higher credit risk, weak liquidity or market concerns.
5. Check the Tenure and Repayment Schedule
A longer tenure increases exposure to interest-rate and issuer risks.
Also examine whether the company has substantial debt maturing around the same period.
6. Identify the Security Structure
Confirm whether the bond is secured, unsecured, subordinated or guaranteed.
For secured bonds, examine the collateral, security cover, charge ranking and debenture trustee disclosures.
7. Read the Bond Terms
Check coupon frequency, maturity, call and put dates, covenants and events of default.
Do not assume that every bond will remain outstanding until its stated maturity.
8. Evaluate Liquidity and Exit Risk
Review available trading volumes, recent transactions and bid–ask quotations.
A listed bond may still be difficult to sell at the expected price.
9. Consider Tax Implications
Calculate the return after tax, not only the stated YTM.
Interest from bonds can increase taxable income, while the treatment of gains may depend on the instrument, transaction and applicable tax provisions. Investors should verify the current rules for their circumstances.
10. Check Portfolio Concentration
Avoid placing a disproportionate amount in one issuer, business group, sector or maturity period.
Diversification cannot remove default risk, but it can reduce the impact of a single adverse event.
Market Momentum And Valuation Relevance
Corporate debt issues reached INR 9,11,078 crore during FY26. Private placements formed approximately 98.8% of the amount raised through debt issues.
This volume gives investors access to issuers across several sectors, ratings and maturity periods. However, not every bond trades frequently in the secondary market.
Investors may therefore encounter recent traded prices, indicative quotations or model-based valuations. Understanding Corporate Bond Valuation helps them interpret these numbers and assess whether the available yield compensates for the underlying risks.
Conclusion
Making wise investment decisions can be daunting and becomes easy if there is someone to guide you with the due diligence, help you monitor your investments, and manage your risks. Grip Invest can help provide research and assess bonds listed on their platform. By following these guidelines, investors can mitigate risks and optimise their investment returns in the Indian Corporate Bond market.
FAQ's On Corporate Bond Valuation
 |
Author: Grip Invest Editorial Team The Grip Invest Editorial Team is a group of Chartered Accountants, MBA (Finance) graduates, and Qualified Research Analysts dedicated to helping you invest smarter. We dive deep into India's fixed income landscape to deliver content that is accurate, up-to-date, and easy to understand. Whether you're exploring bonds, fixed deposits, or other fixed income opportunities, our guides cut through the noise and give you the clarity to make better financial decisions. |
Want to stay at the top of your finances?
Join the community of 4 lakh+ investors and learn more about Grip Invest, the latest financial knick-knacks, and shenanigans in the world of investing.
Happy Investing!
Disclaimer - Investments in debt securities/municipal debt securities/securitised debt instruments are subject to risks including delay and/ or default in payment. Read all the offer related documents carefully. The investor is requested to take into consideration all the risk factors before the commencement of trading.
This communication is prepared by Grip Broking Private Limited (bearing SEBI Registration No. INZ000312836 and NSE ID 90319) and/or its affiliate/ group company(ies) (together referred to as “Grip”) and the contents of this disclaimer are applicable to this document and any and all written or oral communication(s) made by Grip or its directors, employees, associates, representatives and agents. This communication does not constitute advice relating to investing or otherwise dealing in securities and is not an offer or solicitation for the purchase or sale of any securities. Grip does not guarantee or assure any return on investments and accepts no liability for consequences of any actions taken based on the information provided. For more details, please visit www.gripinvest.in
Registered Address - 106, II F, New Asiatic Building, H Block, Connaught Place, New Delhi 110001


