
Leapfrog Engineering Services IPO Analysis 2026: GMP, Details, Financials And Key Risks


Leapfrog Engineering Services IPO opened for subscription on June 17, 2026, and closes on June 19, 2026.1 The SME issue is proposed to list on the BSE SME platform, with BSE acting as the designated stock exchange.
The IPO is a 100% book-built issue. The price band has been fixed at INR 21 to INR 23 per equity share of face value INR 1 each.2 Bids can be made for a minimum of 12,000 equity shares and in multiples of 6,000 equity shares thereafter.
The company will receive proceeds from the fresh issue, while the offer for sale proceeds will go to the selling shareholder.
The fresh issue proceeds are proposed for capital expenditure, working capital requirements and general corporate purposes.
Leapfrog Engineering Services: Company Overview
Leapfrog Engineering Services Limited was incorporated as Leapfrog Informatics Private Limited on May 9, 2005.3 Its name was changed to Leapfrog Engineering Services Private Limited on January 23, 2009, and it became a public limited company on June 21, 2024.
The company is based in Bengaluru, Karnataka. It also has an assembling unit in Begur, Bengaluru Urban.
Leapfrog operates in engineering, procurement, construction and commissioning, commonly called EPCC. In simple terms, it helps industrial clients design, procure, install and commission technical systems required for operations.
Its service areas include:
- Electrical systems
- Instrumentation
- Industrial automation
- Fire safety
- Modular substations
- Building automation
- HVAC systems
The company serves sectors such as oil and gas, food processing, pharmaceuticals and metals. Its promoters are Mr. Prabhav Narasimha Rao and Mrs. Priyashaila Prabhav Rao.
Understanding The Business Model
To understand Leapfrog’s business, readers need to look beyond the word “engineering”. The company earns mainly from project-linked services, where revenue depends on contract execution, billing milestones and customer payments.
The company’s operating revenue comes from three broad streams:
Revenue stream | What it means |
Contract revenue | Revenue from EPCC project execution |
Sale of products | Supply of products linked to engineering solutions |
Sale of services | Service income from technical support and execution |
Here is the revenue split by revenue stream:
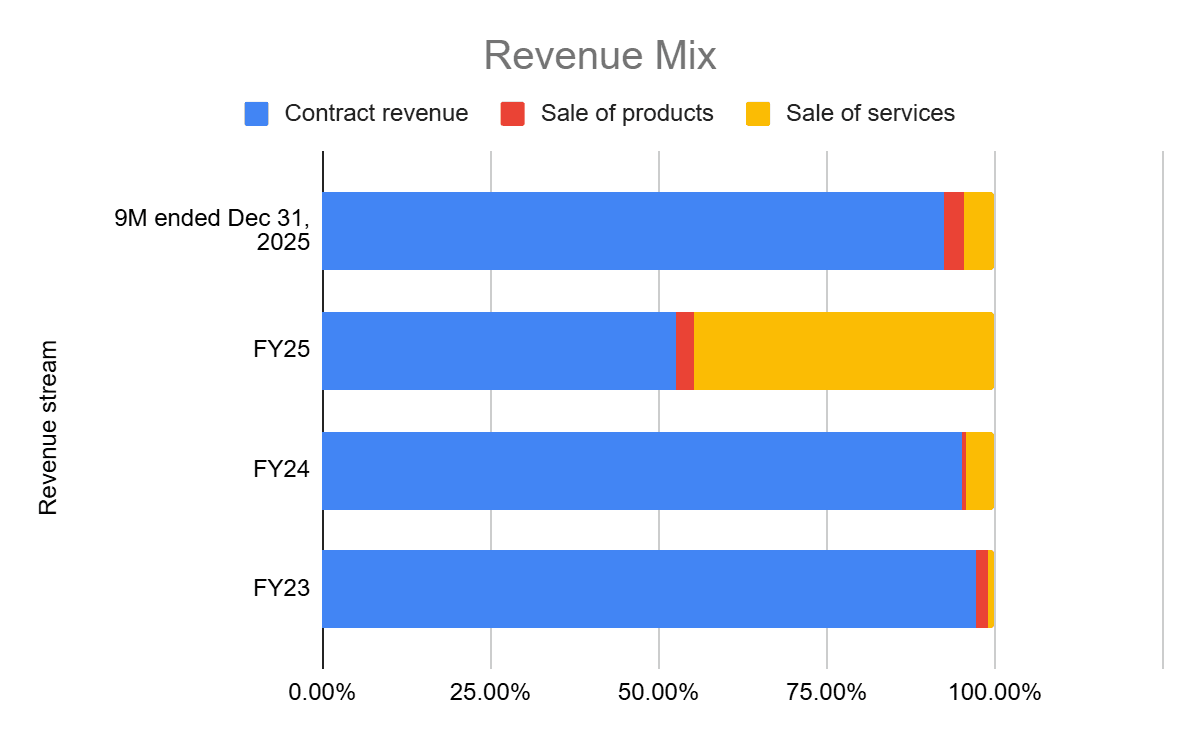
The business has a clear project-led nature. This means orders may look strong, but revenue depends on execution. Delays in customer approvals, vendor supplies, site readiness or working capital can slow down billing.4
Leapfrog’s country wise revenue mix also shows its exposure to overseas projects.5 For the nine months ended December 31, 2025, Kuwait contributed 38.06% of revenue from operations, India contributed 34.23% and the UAE contributed 27.71%. In FY25, Bahrain contributed 52.01%, India 33.62%, Kuwait 10.00%, UAE 4.31% and Singapore 0.06%.
The company also reported an outstanding order book of INR 38,403.09 lakh as of March 31, 2026.6 Of this, domestic orders were INR 5,689.14 lakh, while export orders were INR 32,713.95 lakh. This gives revenue visibility, but it should not be read as guaranteed revenue.
Engineering Services Industry Analysis
Leapfrog’s IPO comes at a time when engineering, infrastructure and industrial automation remain linked to public capex, private manufacturing and export demand. This gives the company a wider opportunity, but also places it in a competitive sector.
Several industry numbers show why engineering services matter in India’s growth cycle:
Industry indicator | Data point |
India engineering goods exports in FY25 | USD 116.67 billion |
YoY growth in FY25 engineering exports | 6.74% |
Engineering share in India’s goods exports | About 25% |
India logistics market in 2024 | USD 317.26 billion |
Expected logistics market by 2029 | USD 484.43 billion |
Logistics market CAGR | 8.8% |
FY25 infrastructure capital outlay | INR 11.11 lakh crore |
Source: IBEF,7 Lesgroup,8
For a company like Leapfrog, the relevant opportunity is not just broad engineering growth. The more specific driver is demand for electrical, automation, fire safety and modular systems in industrial facilities.
However, smaller engineering services companies in India often face pressure from larger engineering players, price-based tendering and client payment cycles. So, industry growth can support demand, but execution quality decides whether that demand converts into profit.
Leapfrog Engineering Services Financial Analysis
Leapfrog Engineering Services' financials show growth from FY23 levels, but the trend is not linear. Revenue from operations increased from INR 10,417.86 lakh in FY23 to INR 15,785.42 lakh in FY24, before falling to INR 13,466.24 lakh in FY25. Here is the financial trend:
Period (INR lakh) | Revenue from operations | EBITDA | PAT | PAT margin |
FY23 | 10,417.86 | 100.51 | 28.30 | 0.27% |
FY24 | 15,785.42 | 1,973.07 | 1,639.27 | 10.38% |
FY25 | 13,466.24 | 2,156.50 | 1,622.47 | 12.05% |
9M ended Dec 31, 2025 | 10,101.28 | 2,018.01 | 1,418.40 | 14.04% |
Source: Lesgroup,9
A simple trend view shows the movement clearly:
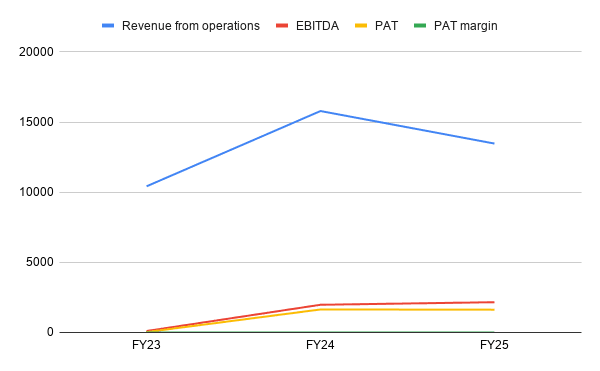
The margin improvement is visible. PAT margin moved from 0.27% in FY23 to 12.05% in FY25 and 14.04% for the nine months ended December 31, 2025. Still, revenue fell 14.69% in FY25 from FY24, so readers should separate margin improvement from top-line consistency.
The key performance indicators below show how Leapfrog’s profitability, leverage, and return metrics changed across FY23, FY24, and FY25:
| Key Performance Indicator | FY25 | FY24 | FY23 |
| ROE | 30.47% | 75.51% | 5.32% |
| ROCE | 32.45% | 68.10% | 10.95% |
| Debt Equity | 0.38 | 0.63 | 2.45 |
| RoNW | 30.47% | 75.51% | 5.32% |
| PAT Margin | 12.05% | 10.38% | 0.27% |
| EBITDA Margin | 16.01% | 12.50% | 0.96% |
The KPI trend shows that Leapfrog improved sharply after FY23, when PAT margin was only 0.27% and debt-equity stood at 2.45. By FY25, PAT margin had increased to 12.05%, EBITDA margin reached 16.01% and debt-equity reduced to 0.38. This indicates better profitability and lower leverage.
However, FY24 looks unusually strong on return ratios, with ROE and RoNW at 75.51% and ROCE at 68.10%. These ratios moderated in FY25 to 30.47% and 32.45%, respectively. So, while the company remains profitable, readers should check whether FY25 reflects a more sustainable level of returns.
A peer comparison helps place Leapfrog’s valuation and return metrics in context. The engineering and EPCC space is broad. Still, the table gives a useful benchmark for scale, profitability, leverage and valuation.
Company- | Revenue from operations | P/E ratio | RoNW | EBITDA margin | PAT margin | Debt-equity |
Engineers India Limited | INR 302,835.26 lakh | 27.14x | 17.76% | 16.14% | 15.36% | 0.01 |
Konstelec Engineers Limited | INR 19,370.68 lakh | 17.60x | 4.34% | 6.79% | 2.21% | 0.7 |
Leapfrog Engineering Services Limited | INR 13,466.24 lakh | 14.65x | 30.47% | 16.01% | 12.05% | 0.38 |
The comparison shows that Leapfrog is much smaller than Engineers India and also smaller than Konstelec Engineers by FY25 operating revenue. However, its FY25 RoNW of 30.47% is higher than both listed peers in this set. Its EBITDA margin of 16.01% is close to Engineers India’s 16.14% and above Konstelec’s 6.79%.
On valuation, Leapfrog’s P/E of 14.65x at the cap price of INR 23 is lower than Engineers India’s 27.14x and Konstelec’s 17.60x.
This does not automatically make it cheaper, because SME issues carry different liquidity, scale and execution risks. A better reading is that Leapfrog’s valuation needs to be weighed against its smaller base, client concentration, export-linked order book and working capital requirements.
Risks To Consider Before Investing In Leapfrog IPO
The IPO also carries business risks that readers should weigh with the growth numbers. These risks are not unusual for project-led engineering companies, but the exact figures matter.
The following points need attention:
- Customer concentration is high: The top 10 customers accounted for 91.37% of revenue from operations for the nine months ended December 31, 2025. The figure was 85.49% in FY25, 98.81% in FY24 and 99.32% in FY23.10
- Single-customer dependence remains material: The top customer contributed 38.06% for the nine months ended December 31, 2025. In FY24, the top customer contributed 74.75%.11
- Export exposure is significant: As of March 31, 2026, export orders formed INR 32,713.95 lakh of the INR 38,403.09 lakh outstanding order book. Currency movement, overseas execution and geopolitical factors can affect outcomes.12
- Working capital needs are high: The company needs bank guarantees, fixed deposits as margin money, advance payments to suppliers and funds tied up in project execution.
These risks do not cancel the business opportunity. They simply show why readers should study execution, cash flows and customer mix before making any decision.
Diversifying Beyond Equity Investments
Leapfrog Engineering Services IPO gives investors exposure to a project based engineering business with growth potential. However, IPOs and equities can be impacted by market movements, valuations, and company specific risks.
A diversified portfolio usually includes different asset classes that serve different purposes. While equities may help with long term wealth creation, fixed income and other investments can help balance risk and provide stability.
| Investment Category | Purpose in Portfolio | Examples |
| Equity Investments | Growth and long-term capital appreciation | Stocks, IPOs, Equity Mutual Funds |
| Fixed Income Investments | Stability and regular income potential | Corporate Bonds, Corporate FDs, Government Securities |
| Alternative Investments | Portfolio diversification beyond traditional assets | REITs, Invoice Discounting, Asset Leasing |
| Hybrid Investments | Balance between growth and stability | Hybrid Mutual Funds, Balanced Investment Options |
Conclusion
Leapfrog Engineering Services IPO offers investors an opportunity to participate in the growth of an engineering and industrial solutions company with exposure to sectors such as automation, infrastructure, and manufacturing. The company has shown improvement in profitability, margins, and leverage metrics, along with a strong order book that provides business visibility.
However, investors should also consider factors such as high customer concentration, export dependence, working capital requirements, and the risks associated with SME listed companies before making an investment decision.
While IPOs can provide growth opportunities, a well balanced portfolio often requires diversification across different asset classes. Along with equity exposure, investors can explore fixed income options such as corporate bonds, corporate FDs, and other alternative investments to balance risk and build a more stable portfolio.
Grip Invest provides access to curated investment opportunities across fixed income and alternative investment categories, helping investors diversify beyond traditional equity investments based on their financial goals and risk appetite.
FAQs On Leapfrog IPO Analysis
Author: Grip Invest Editorial Team The Grip Invest Editorial Team is a group of Chartered Accountants, MBA (Finance) graduates, and Qualified Research Analysts dedicated to helping you invest smarter. We dive deep into India's fixed income landscape to deliver content that is accurate, up-to-date, and easy to understand. Whether you're exploring bonds, fixed deposits, or other fixed income opportunities, our guides cut through the noise and give you the clarity to make better financial decisions. |
Want to stay at the top of your finances?
Join the community of 4 lakh+ investors and learn more about Grip Invest, the latest financial knick-knacks, and shenanigans in the world of investing.
Happy Investing!
Disclaimer - Investments in debt securities/municipal debt securities/securitised debt instruments are subject to risks including delay and/ or default in payment. Read all the offer related documents carefully. The investor is requested to take into consideration all the risk factors before the commencement of trading.
This communication is prepared by Grip Broking Private Limited (bearing SEBI Registration No. INZ000312836 and NSE ID 90319) and/or its affiliate/ group company(ies) (together referred to as “Grip”) and the contents of this disclaimer are applicable to this document and any and all written or oral communication(s) made by Grip or its directors, employees, associates, representatives and agents. This communication does not constitute advice relating to investing or otherwise dealing in securities and is not an offer or solicitation for the purchase or sale of any securities. Grip does not guarantee or assure any return on investments and accepts no liability for consequences of any actions taken based on the information provided. For more details, please visit www.gripinvest.in
Registered Address - 106, II F, New Asiatic Building, H Block, Connaught Place, New Delhi 110001


