

How To Calculate FD Interest: Formula, Examples, And Tips


The Indian investment landscape comprises a range of assets, from high-risk growth instruments to low-risk, fixed-income securities. However, one asset has remained a popular choice among investors, despite the growing modernisation and dynamic changes in the segment. This asset category is fixed deposits.
Despite its popularity and consistent use, many users overlook the nuances of calculating FD interest, resulting in lower returns.
Contrary to popular belief, the FD maturity amount calculation has various aspects that determine the returns.
A key aspect is whether the return rate is simple interest or compound interest. If simply the mathematical difference is considered, assuming an investment of INR 1 lakh for 5 years, the graph shows the impact of 8% simple interest vs 8% compounds interest.
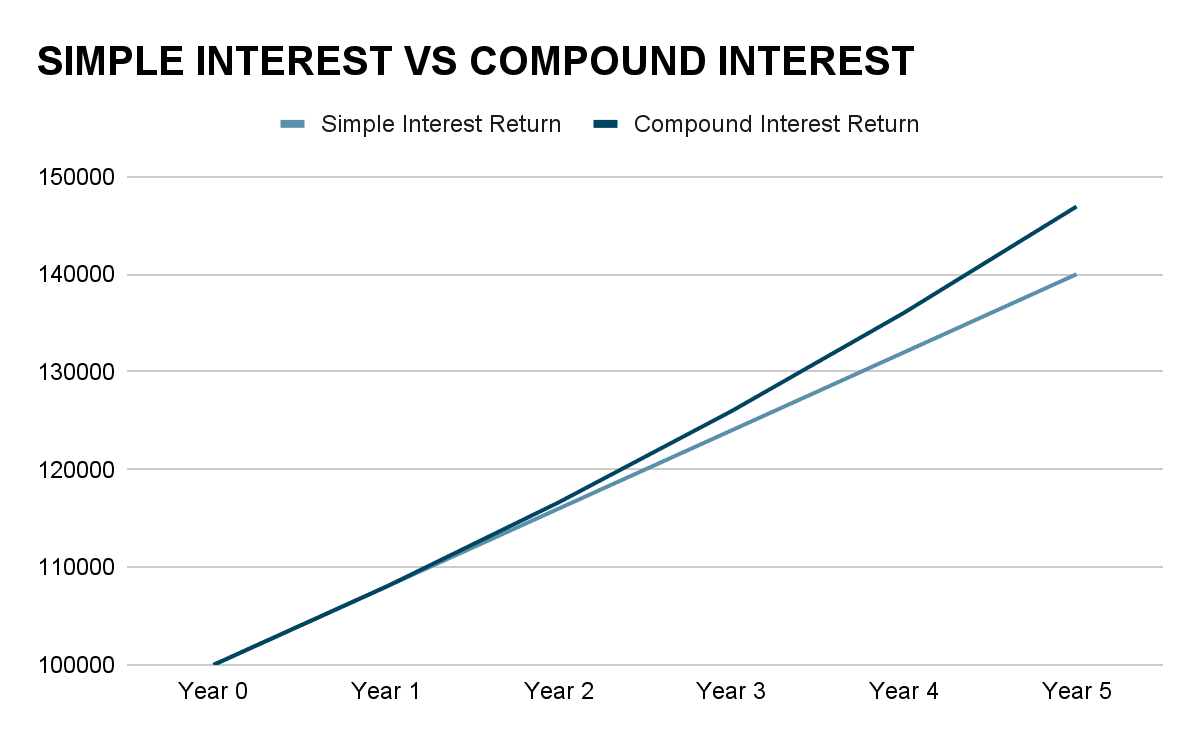
The fact that compound interest returns beat the simple interest yield over the long-term might be well-known, but investors often think that a fixed deposit fundamentally compounds interest. If you think so too, this detailed guide on how to calculate FD interest is a must-read.
Types Of FD Interest Calculation
There are two ways to calculate the FD interest rate. These two types of FD interest are simple interest and compound interest. Let us analyse how each of these mechanisms operates, their FD interest formula, and more, to optimally understand how to calculate FD interest.
1. Simple Interest FD
Under the simple interest FD formula, interest is calculated only on the principal amount for the entire tenure. In this case, interest earned is not reinvested; it is accumulated or paid linearly. Simple interest is levied on FDs in the case of short-term deposits or non-cumulative deposits.
In the case of non-cumulative deposits, since the interest earned is paid out to the customer monthly or quarterly, the return does not get accumulated, resulting in a simple interest rate.
For instance, if Mr K invests INR 10,000 in a non-cumulative FD that pays 8% p.a. return. In the first year, 8% return is calculated on INR 10,000. In the second year as well, since the interest of the first year is paid out to the investor, interest is levied on INR 10,000 only.
A similar situation occurs for short-term deposits, or deposits of one year or less. Such FDs do not have enough time to benefit from the impact of compounding, as most FDs are usually compounded annually. The priority of these short-term FDs is to maintain liquidity and security, whilst optimising fund usage.
2. Compound Interest FD
Primarily, a majority of deposits earn compound interest, provided that they are cumulative and have a sufficient tenure (usually over a year). In the case of compound interest, the interest rate is levied not only on the principal, but also on the interest accrued. Therefore, this interest-on-interest effect is the primary feature that distinguishes compound interest from simple interest.
The main goal of a compound interest fixed deposit is to offer stable growth through fixed returns.
This enhances portfolio stability and investor confidence during volatility or high-risk investments.
Since the distinction between simple and compound interest stems from their meaning, to effectively understand the difference between the two, an investor should analyse the FD interest formulas.
FD Interest Formula Explained
The formula for simple interest is simple and self-explanatory. The simple interest FD formula is given below.
Simple Interest (SI) = (P × R × T) / 100
Where, P = Principal or the original amount invested
R = Rate of interest
T = Time or tenure for which the deposit is made
For instance, if Mr K invested INR 10,000 at 6% p.a. interest for 2 years, the interest earned by him at the end of this tenure would be INR 1,200. Therefore, his total amount becomes INR 11,200. However, when it comes to compound interest, there are a few more aspects.
Discussed below is the compound interest formula used to calculate the total amount after compounding interest is levied.
A = P × (1 + r/n)^(n×t)
Where A = Total amount after a particular tenure
P = Principal
r = Rate of interest
n = Compounding frequency
t = Tenure
When the principal is deducted from this amount, we get the value of total interest earned.
Therefore, Compound Interest (CI) = A - P
Where A = Amount calculated with the first formula
P = Principal
While parameters like the principal, return, and tenure are common across both simple interest and compound interest, the variable n or compounding frequency requires a nuanced look.
Compounding Frequency
The number of times interest is calculated and added to the principal in a particular year is called compounding frequency. For example, in a quarterly compounding FD formula, the value of n will be 4 because quarterly interest compounding means interest is levied 4 times in a year. Similarly, if interest is compounded half-yearly, then the interest is calculated twice a year, meaning the value of n will be 2.
The graph below is an FD interest calculation example to show the impact of compounding frequency on returns, assuming an INR 1 lakh FD, with 7% p.a. interest for 1 year.
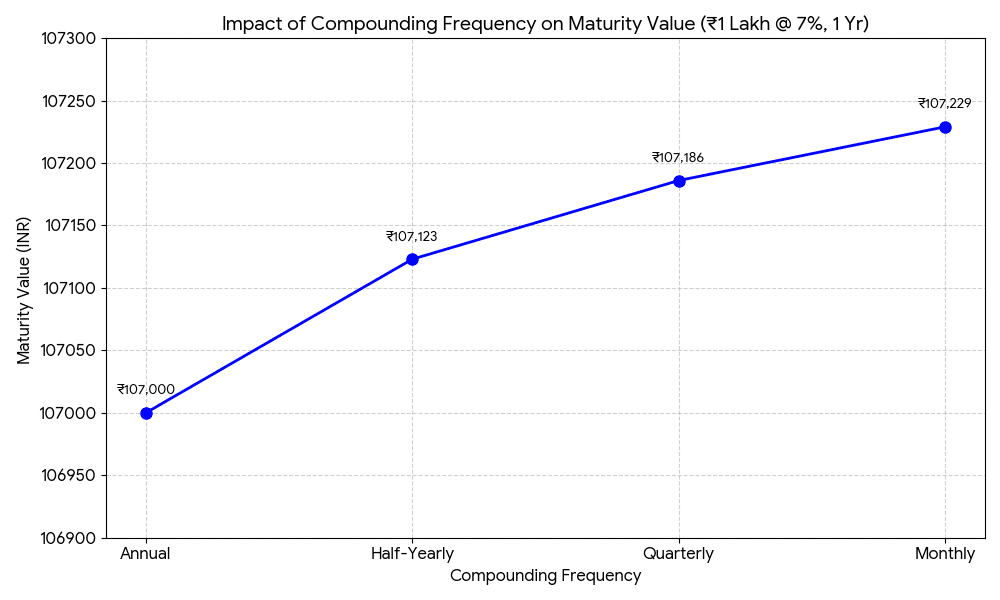
The graph clearly illustrates how, even on a 1-year horizon, a quarterly, half-yearly, or monthly compounding adds additional returns. Although the per annum interest remains the same at 7%, when interest is compounded more than once, given the interest-on-interest concept of compound interest, the accrued value on which interest is levied expands. Thus, the total return also increases.
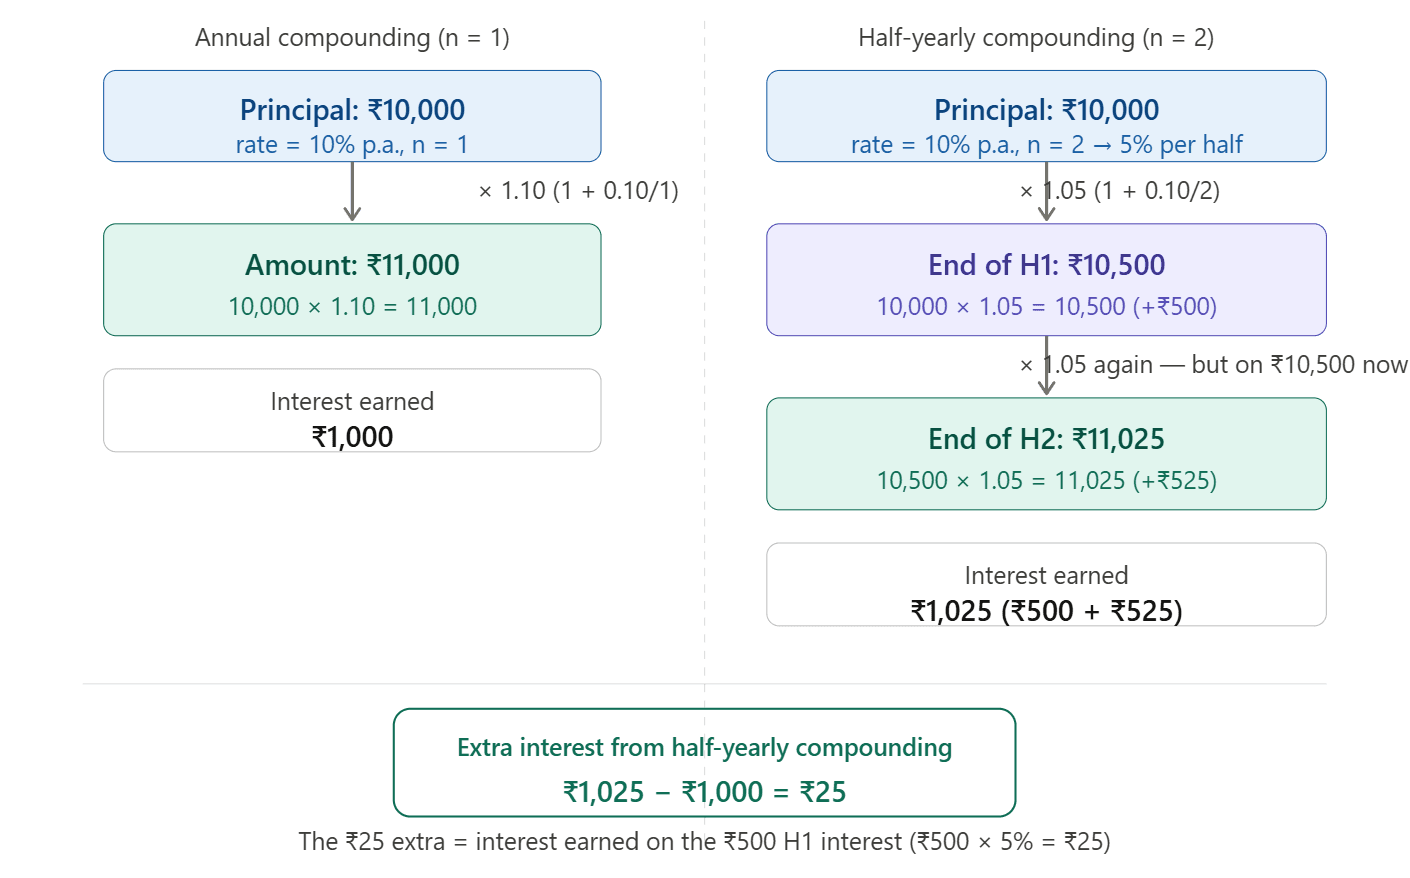
For example, INR 10,000 is invested for 1 year at 10% p.a. If interest is compounded annually, he will earn an interest of INR 1000, as the total amount becomes INR 11,000. If the interest is compounded half-yearly, the effective interest for each half-yearly period is 5% (10/2). In the first half, the principal is INR 10,000, and at 5% interest, the amount becomes INR 10,500. Now, interest is calculated on INR 10,500 (the base expands). At 5% interest, the final amount is INR 11,025. Thus, through half-year compounding, the return increased.
Now, let us take an example to understand how compounding helps wealth to grow over the long-term.
Examples Of FD Interest Calculation
The amount of interest varies with different circumstances. Let us take examples to understand some key return trends.
- Cumulative VS Non-Cumulative FD Returns
Suppose Mr K and Mr M invest INR 10,00,000 each for a period of 10 years at 7% interest. However, while Mr K’s FD is cumulative, meaning the interest matures with the principal after tenure ends, Mr M withdraws the interest monthly.
After 10 years, Mr K earns an interest of INR 9,67,151, resulting in the total amount becoming INR 19,67,151. However, since Mr M withdrew the interest, rather than reinvesting it, the interest gets calculated at simple interest. Therefore, he withdrew a total of INR 7,00,000 (total interest) and the principal of INR 10,00,000 is repaid on maturity.
Notice how Mr K earned about INR 2.67 lakhs more than Mr M. This is because Mr M did not earn interest on interest.
- Impact of Tenure
Suppose both Mr K and Mr M invested INR 1,00,000 at 7%. While both FDs are cumulative, Mr K invests for 1 year, while Mr M invests for 5 years. On maturity, Mr K would earn INR 7,000 interest, while Mr M would earn INR 40,255 as interest.
Undertaking such calculations online is tedious and error-prone. Therefore, the FD calculators in India help automate calculations and enable investors to calculate anticipated returns before undertaking an investment. FD calculators of SBI, HDFC, ICICI, or Grip enable FD return calculations in a fraction of a second.
This understanding of how to calculate the monthly FD interest payout and other return forms can aid in optimal FD investment. However, traditional fixed deposits are not the only fixed-income investments.
Monthly Interest For 1 Lakh At Different Interest Rates
Interest rates vary based on tenure and investor category. Below is a comparison table:
| Interest Rate | Annual Interest | Monthly Payout |
| 6% | INR 6,000 | INR 500 |
| 7% | INR 7,000 | INR 583 |
| 8% | INR 8,000 | INR 667 |
| 9% | INR 9,000 | INR 750 |
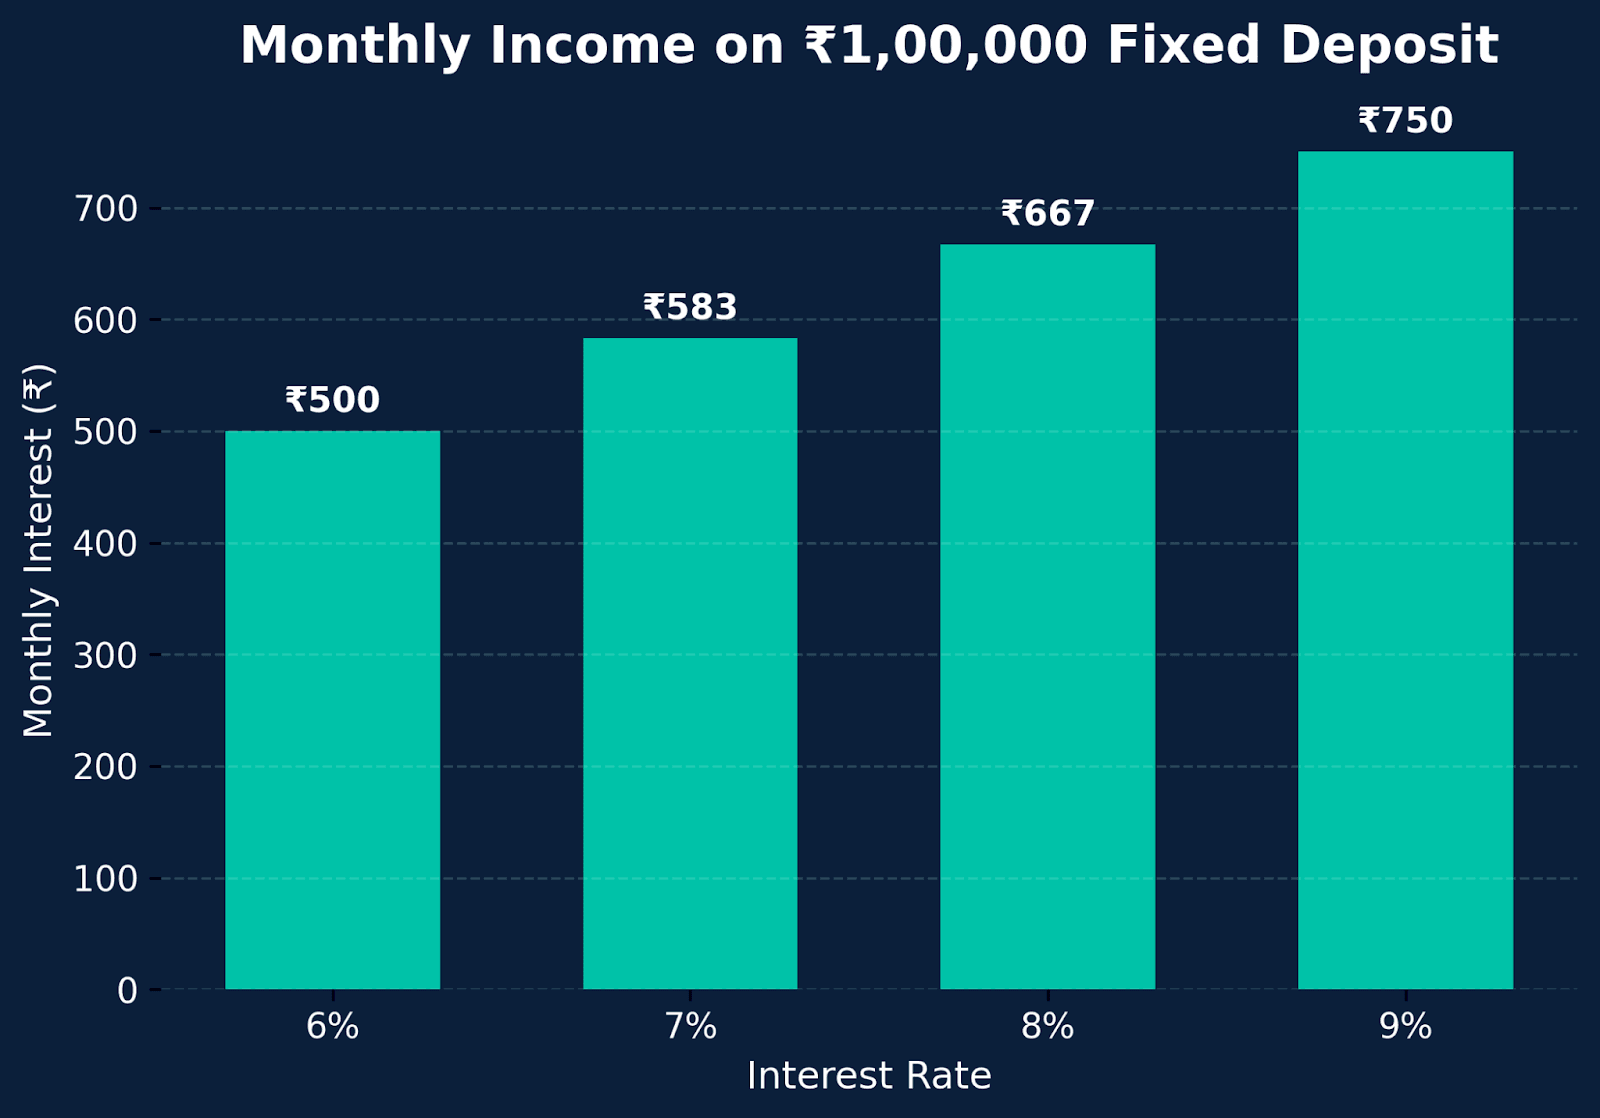
As seen above, a 1% increase in interest rate can significantly increase your FD monthly income in India over time:
Senior Citizen Variation
Seniors typically qualify for an increase of 0.25% to 0.50% over standard rates on their deposit accounts. In this example, 8.5% vs. 8%, you would receive the corresponding FD monthly income India.
- Annual interest: INR 8,500
- Monthly payment: INR 8,500 ÷ 12 = INR 708
The extra interest could make a significant difference in your overall monthly financial picture during retirement.
5 Lakh FD Interest Per Month : Calculation and Example
When calculating FD interest, the interest classification is usually done using simple interest for NC-options, and the amount you will receive will depend on the annual interest rate at the time you make the deposit.
For example, if you decide to invest INR 5 lakh at an interest rate of 7% for three years with a monthly payout, you can expect to receive approximately INR 2,917 in interest from your INR 5 lakh FD each month. Over the years, this amount is a fairly good amount, but keep in mind that through the effects of inflation, your purchasing power will reduce.
Rates vary depending on tenure length, with longer tenures generally yielding higher interest rates. Seniors can receive between 0.25% and 0.50% higher rates than other customers, thus increasing their monthly income.
Monthly versus annual payment options are primarily convenience and budgeting related. In fact, monthly payments are more manageable for regular budgets, whereas annual payments may provide the investor with better options for reinvestment of funds received through annual payments.
Monthly Interest On INR 10 Lakh FD
The income from a fixed deposit depends mainly on the interest rate offered by the institution. In India, most large banks currently offer average FD rates around 5.5% to 7% for regular customers, depending on tenure2. Corporate fixed deposits and certain alternative fixed-income instruments may offer slightly higher rates to attract investors.
Many banks also offer a monthly interest payout option, allowing investors to receive a monthly income from an INR 10 lakh FD, which can be useful for retirees or individuals looking for a steady cash flow. For example, Aman wants to invest INR 10 Lakh in a safe and steady asset.
Therefore, he considers investing in an FD. However, he is willing to invest through either banks (regular FD) or through companies (corporate FD). The table below highlights the comparison of bank FD rates and corporate FD rates offered by Grip Invest.
| Investment Type | Interest Rate | Monthly Income | Annual Interest |
| Regular FD | 6% | INR 5,000 | INR 60,000 |
| Corporate FD | 8% | INR 6,666 | INR 80,000 |
Both investment types help create a steady return base. However, corporate FDs have an edge in returns due to the additional risk they entail. Thus, investors seeking higher income with greater risk can consider corporate FDs.
INR 15 Lakh FD vs Other Income Options
| Investment Option | Key Features | Risk Level | Best For |
| Fixed Deposit (FD) | Guaranteed returns, fixed interest rate, capital protection, monthly or cumulative payout options | Low | Conservative investors, retirees, and those seeking steady income |
| Mutual Funds | Potential for higher long-term returns, market-linked growth, different categories available | Moderate to High | Investors with a longer horizon and willingness to take market risk |
| Stocks | High return potential through capital appreciation and dividends, but prices can fluctuate significantly | High | Experienced investors who can handle volatility |
| Savings Account | High liquidity, easy access to funds, very low return | Very Low | Emergency funds and short-term parking of money |
| Corporate Bonds | Better yield than savings accounts, fixed interest in many cases, credit-rated instruments | Low to Moderate | Investors looking for higher fixed-income returns |
| Debt Mutual Funds | Diversified debt exposure, relatively stable returns, tax efficiency in some cases | Low to Moderate | Investors seeking better returns than FDs with controlled risk |
How Can We Calculate Monthly Income On INR 20 Lakh FD?
The basic formula for monthly FD income is:
Monthly Interest = Principal × Interest Rate / 12*100?
Let us calculate the estimated monthly income from a INR 20 lakh FD at different interest rates.4
Interest Rate | Annual Interest | Monthly Income |
| 6% | INR 1,20,000 | INR 10,000 |
| 7% | INR 1,40,000 | INR 11,667 |
| 8% | INR 1,60,000 | INR 13,333
|
Source: Bajaj Finserv,5
Scenario 1: 6% FD Interest Rate
At 6% annual interest:
- Total yearly earnings = INR 1.2 lakh
- Monthly income = around INR 10,000
This rate is commonly offered by traditional banks for standard tenure FDs.
Scenario 2: 7% FD Interest Rate
At 7%:
- Annual earnings = INR 1.4 lakh
- Monthly payout = approximately INR 11,667
Several banks and NBFCs offer these rates depending on tenure and market conditions.
Scenario 3: 8% FD Interest Rate
At 8%:
- Annual returns = INR 1.6 lakh
- Monthly income = approximately INR 13,333
Certain corporate FDs and high-yield fixed-income products may offer rates close to this range. Investors also explore platforms like Grip Invest for corporate FD opportunities that can potentially provide higher returns than traditional bank FDs.
Monthly Interest On INR 50 Lakh FD
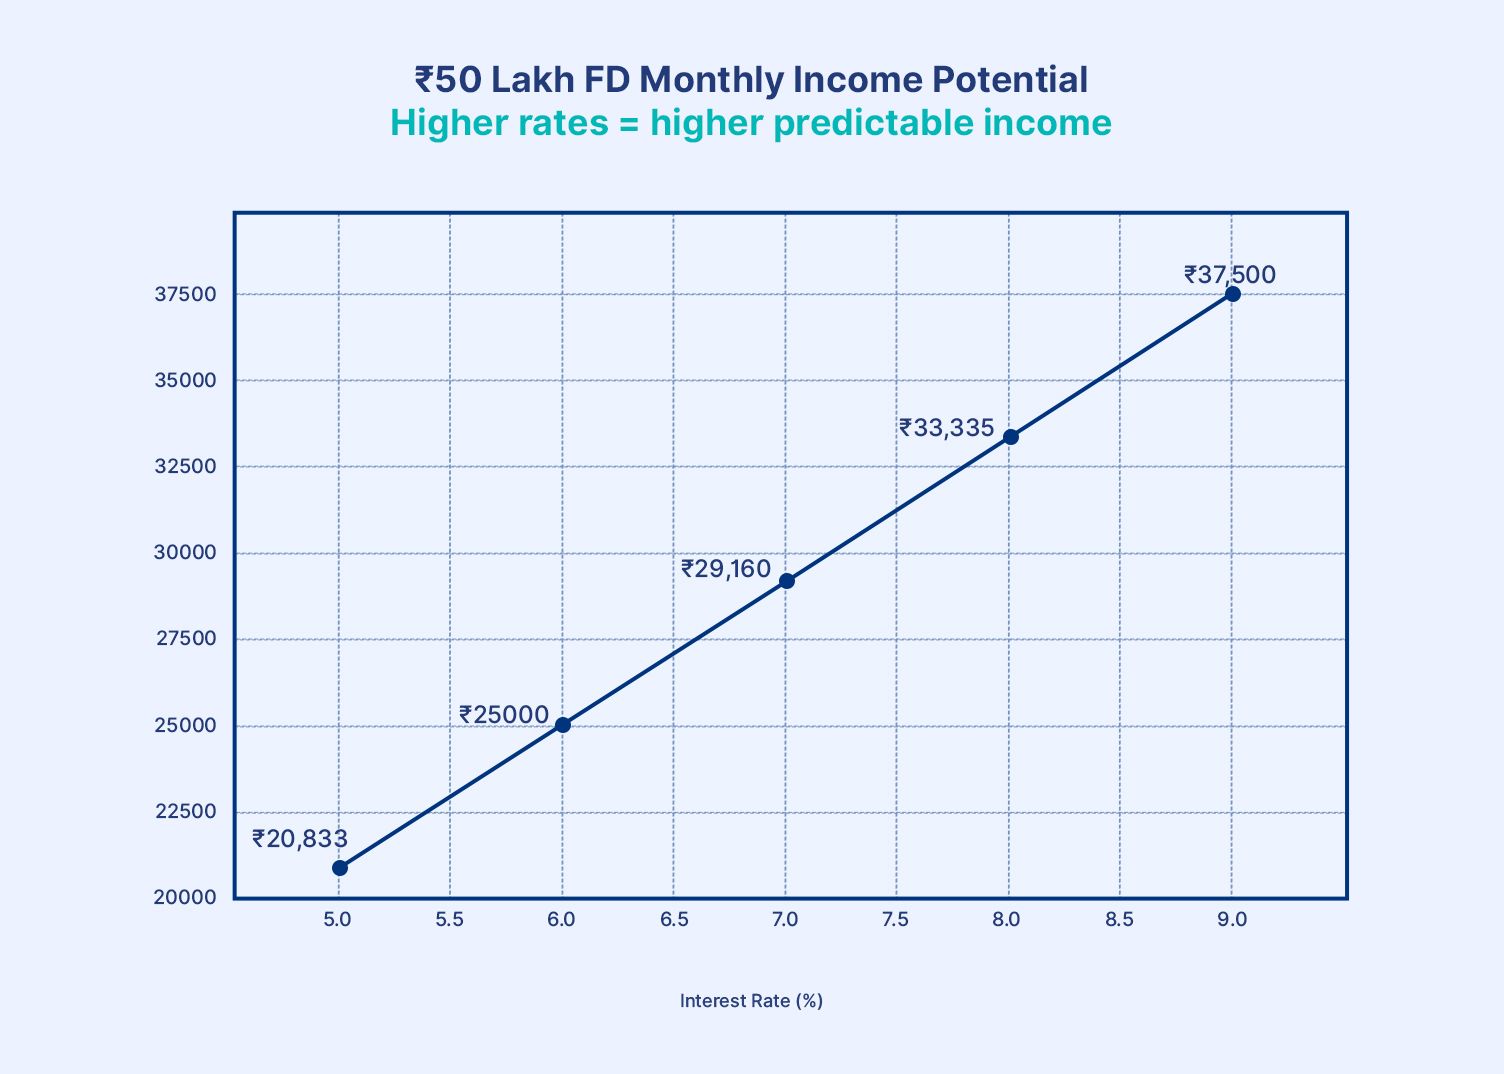
1. Basic Calculation Explanation
You can simply compute the annual interest by multiplying the principal by the effective annual interest rate. The resulting annual interest is divided by 12 to obtain the monthly interest.
The framework is simple and enables an investor to estimate fixed-deposit income and understand how rate changes affect earnings.
Monthly Interest On INR 1 Crore FD
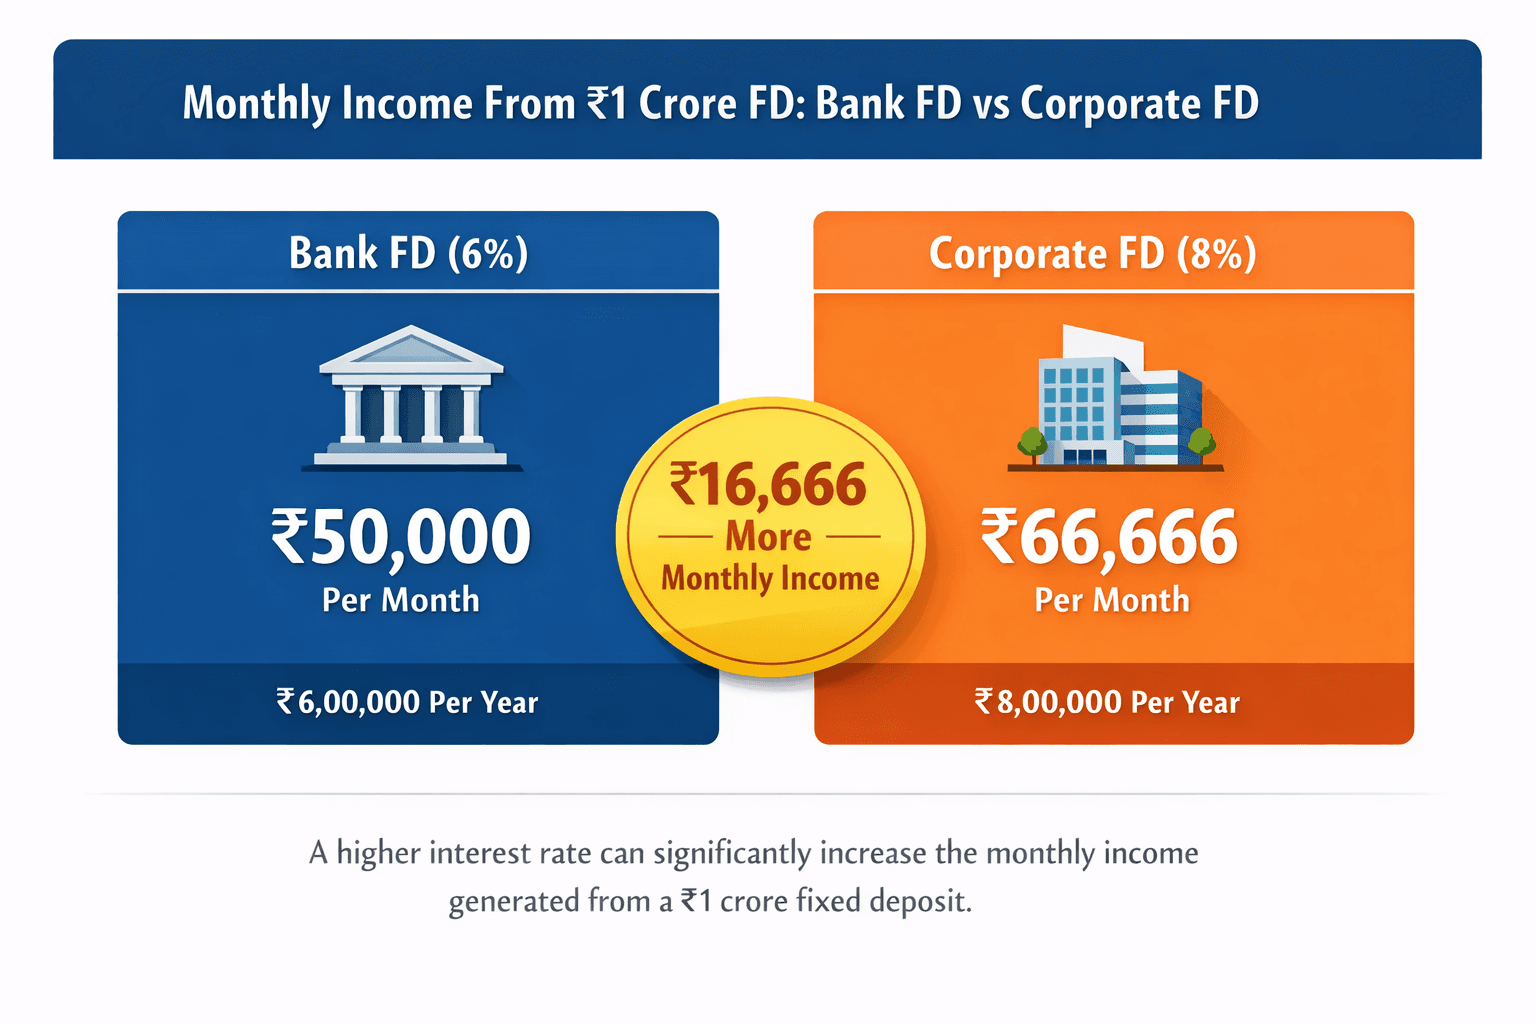
The 1 crore FD interest per month depends on several factors, such as the type of institution offering the FD and the investor's age. For example, traditional bank fixed deposits usually offer lower rates compared to corporate FDs. Furthermore, senior citizens are often eligible for slightly higher interest rates than regular investors.
Here is a simplified comparison showing how interest rates can affect fixed deposit monthly income on a INR 1 Crore investment.
| FD Type | Interest Rate | Monthly Interest | Annual Interest |
| Regular Bank FD | 6% | INR 50,000 | INR 6,00,000 |
| Senior Citizen Bank FD | 7% | INR 58,333 | INR 7,00,000 |
| Corporate FD | 8% | INR 66,666 | INR 8,00,000 |
INR 50,000 FD For 10 Years: Return Calculation Example
To understand how an FD of INR 50,000 will grow in 10 years, one can check the various interest rate options available with a FD calculator for 10 years. The returns on an FD are largely dependent on the rate of interest being offered and the compounding effect. A small variation in the rate of interest can bring about a significant difference in the returns.
Assumed Interest Rate Scenarios (6%, 7%, 8%)
Typically, most banks provide long-term fixed deposits with interest rates ranging from 6% to 8%. Conservative investors will always opt for fixed banks rather than a slightly higher interest rate. The three scenarios below represent low, medium, and relatively higher returns on safe investments.
- 6%: Low-risk and steady returns
- 7%: Balanced growth and safety
- 8.2-8.7%: Higher returns, but less available
Maturity Value Comparison
The higher the interest rates, the more the maturity amount will increase due to the compounding effect over a period of 10 years. The effect of higher interest rates is not only additive but also multiplicative. Hence, fixed deposits for a longer period of time become more attractive when you get better interest rates.
Below is a comparison of 10-year FD maturity values for INR 50,000, assuming quarterly compounding (standard in India). It shows how rate differences amplify wealth via compounding.
| Interest Rate | Investment | Tenure | Maturity Value (Approx) |
| 6% per annum | INR 50,000 | 10 years | INR 89,542 |
| 7% per annum | INR 50,000 | 10 years | INR 98,357 |
| 8% per annum | INR 50,000 | 10 years | INR 1,08,022 |
FD Vs Other Fixed Income Investments
Fixed deposits are a reliable savings tool, but their returns often struggle to outpace inflation, especially when the Consumer Price Index (CPI) hovers around 4% to 5% annually.
With most bank FDs offering 6.5% to 7% pre-tax returns, the real post-tax yield for investors in the 30% tax bracket can drop to as low as 4.5% to 5%, barely keeping pace with inflation.
This is where alternative fixed income instruments offer a meaningful advantage. Here is how KVB FDs compare against other popular fixed income options:
| Investment | Returns | Safety | Liquidity | Tax Benefit |
| KVB FD | 6.25% to 6.80% | High (DICGC insured up to ?5 lakh) | Moderate (premature withdrawal with penalty) | 80C for tax saver FD |
| Corporate FDs (Grip) | 8% to 10% | Moderate (NBFC-issued, uninsured) | Low to moderate | No |
| Corporate Bonds (Grip) | 9% to 12.5% YTM | Moderate to high (rated instruments) | Moderate (secondary market) | No |
| Government Securities | 7% to 7.5% | Highest (sovereign guarantee) | High (exchange traded) | No |
| Debt Mutual Funds | 6% to 8% | Moderate | High (T+1 redemption) | Indexation benefit |
Conclusion
Understanding how to calculate FD interest is essential for making informed investment decisions and maximising your returns. Whether your deposit earns simple interest or compound interest, factors like tenure, compounding frequency, and payout structure can significantly impact your final maturity amount.
While fixed deposits remain a reliable option for stable and predictable income, investors today must look beyond just safety. Evaluating returns in the context of inflation and comparing different fixed income options can help build a more efficient and balanced portfolio.
By using the right FD interest formula or online calculators, you can plan your investments better, choose the right tenure, and align your returns with your financial goals.
If you are looking to go beyond traditional FDs and explore higher-yield fixed income opportunities, platforms like Grip Invest can help you discover curated investment options with better return potential and transparency.
FAQs
1. How is FD interest calculated?
In the case of simple interest, FD interest is levied on the principal alone. However, in the case of compound interest, FD interest is levied on the principal and the total interest accrued.
2. What is compound interest in FD?
In the case of compound interest, the interest rate is levied not only on the principal, but also on the interest accrued. Therefore, this interest-on-interest effect enables exponential capital growth.
3. Which FD gives the highest returns?
High-yield FDs, also known as corporate FDs, can offer higher interest than regular FDs. On Grip, investment-grade high-yield FDs offer 8-10% returns, with both cumulative and non-cumulative payment options.
Want to stay at the top of your finances?
Join the community of 4 lakh+ investors and learn more about Grip Invest, the latest financial knick-knacks, and shenanigans in the world of investing.
Happy Investing!
Disclaimer - Investments in debt securities/municipal debt securities/securitised debt instruments are subject to risks including delay and/ or default in payment. Read all the offer related documents carefully. The investor is requested to take into consideration all the risk factors before the commencement of trading.
This communication is prepared by Grip Broking Private Limited (bearing SEBI Registration No. INZ000312836 and NSE ID 90319) and/or its affiliate/ group company(ies) (together referred to as “Grip”) and the contents of this disclaimer are applicable to this document and any and all written or oral communication(s) made by Grip or its directors, employees, associates, representatives and agents. This communication does not constitute advice relating to investing or otherwise dealing in securities and is not an offer or solicitation for the purchase or sale of any securities. Grip does not guarantee or assure any return on investments and accepts no liability for consequences of any actions taken based on the information provided. For more details, please visit www.gripinvest.in
Registered Address - 106, II F, New Asiatic Building, H Block, Connaught Place, New Delhi 110001


