

Market Breadth Indicators: How to Measure Market Strength Beyond Index Levels


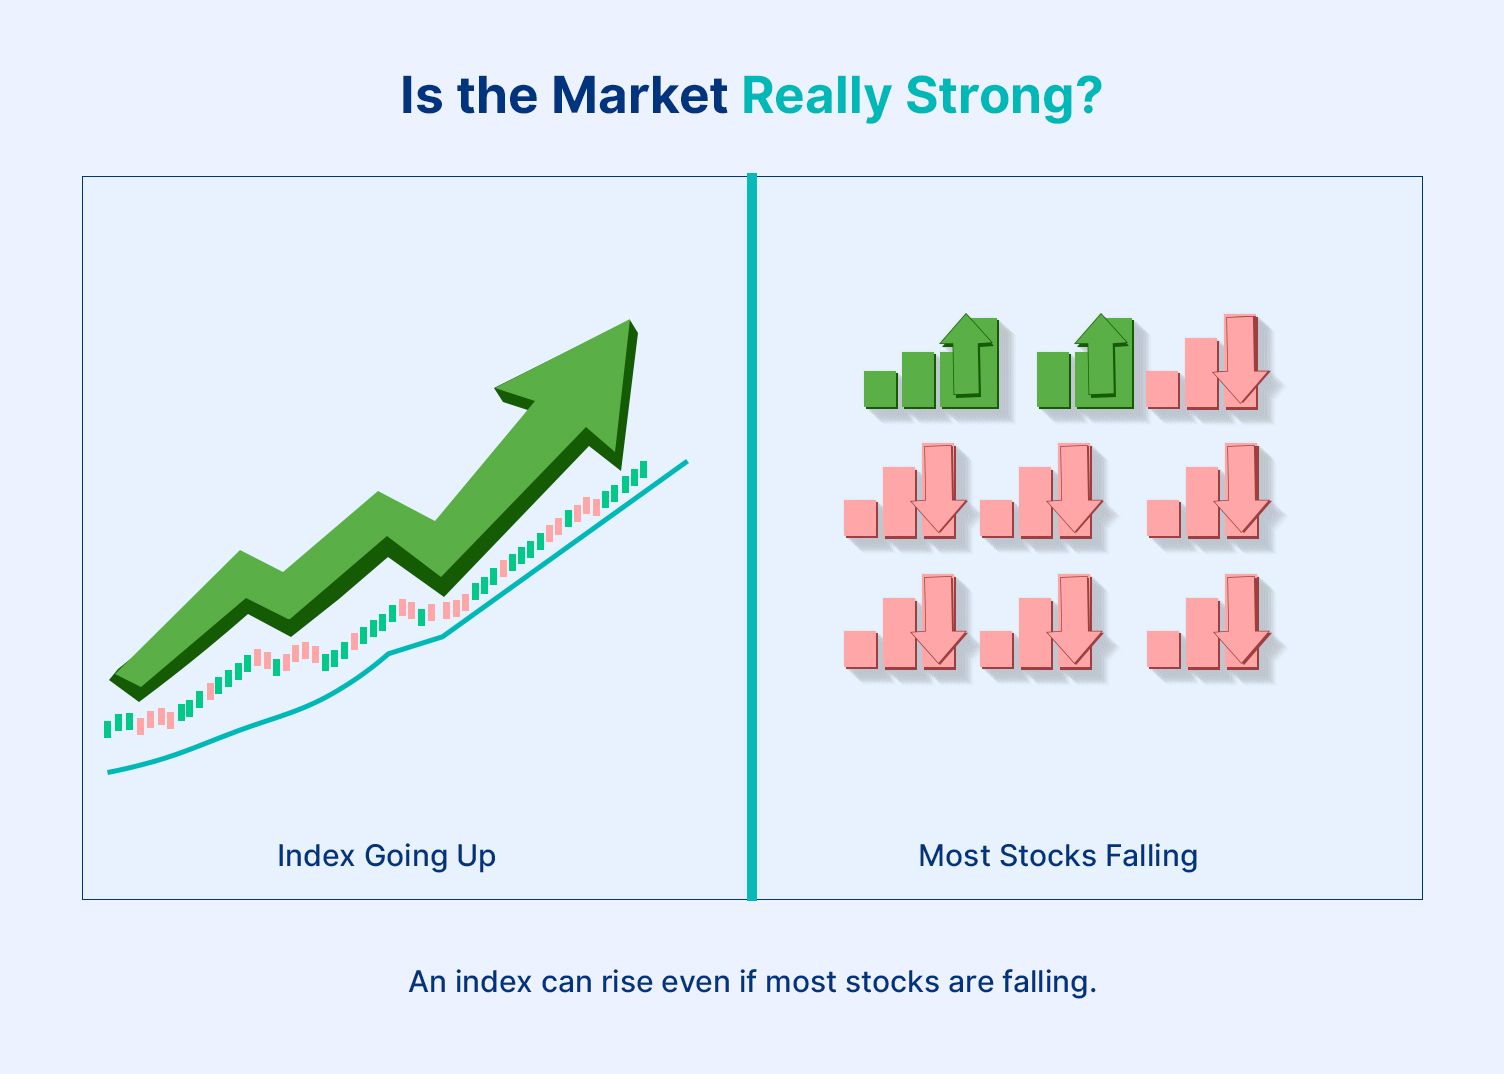
The most common and widely used way to read market trends is through its indices. So when the market moves sharply, investors often resort to evaluating Nifty and Sensex movements. However, despite their broad importance, indexes do not tell the full story. A rise in the index can be caused by a few large companies performing well while many other stocks quietly decline. This means that indexes are influenced by various factors and can paint a misleading picture if not studied in context.
This is where market breadth indicators become useful. The shift in focus from questions like “Is the index up or down?” to asking more detailed questions like “How many stocks are moving with it?”
What Are Market Breadth Indicators?
Market breadth indicators are tools that are used in stock market breadth analysis. They are used to measure overall market participation by comparing the number of stocks advancing (rising) with those declining (falling). These tools act as strength indicators, giving investors a clearer picture of whether buying or selling pressure is widespread across the market.
Think of it like checking the health of a classroom. If only two students are active while the rest are silent, the room is not truly energetic. Similarly, if only a few stocks are pushing an index higher, the market may not be as strong as it appears.
Why traders track them
Traders track breadth to confirm if a trend is genuine. Usually, when most stocks are rising along with the index, market participation is strong, and momentum is healthy. But if the index rises while fewer stocks participate, it may signal caution. This situation, called divergence, can sometimes precede a market correction.
In India, tools such as the advance decline line NSE or a Nifty breadth chart are commonly used to assess how broadly the market is moving. Even beginners can benefit from checking whether strength is widespread or limited to a few large-cap stocks.
Key Market Breadth Indicators
If you truly want to understand the market and its positioning, it is important to examine tools that measure participation in different ways. Each of the following market breadth indicators is built from advancing and declining stock data, but they calculate and present it differently.
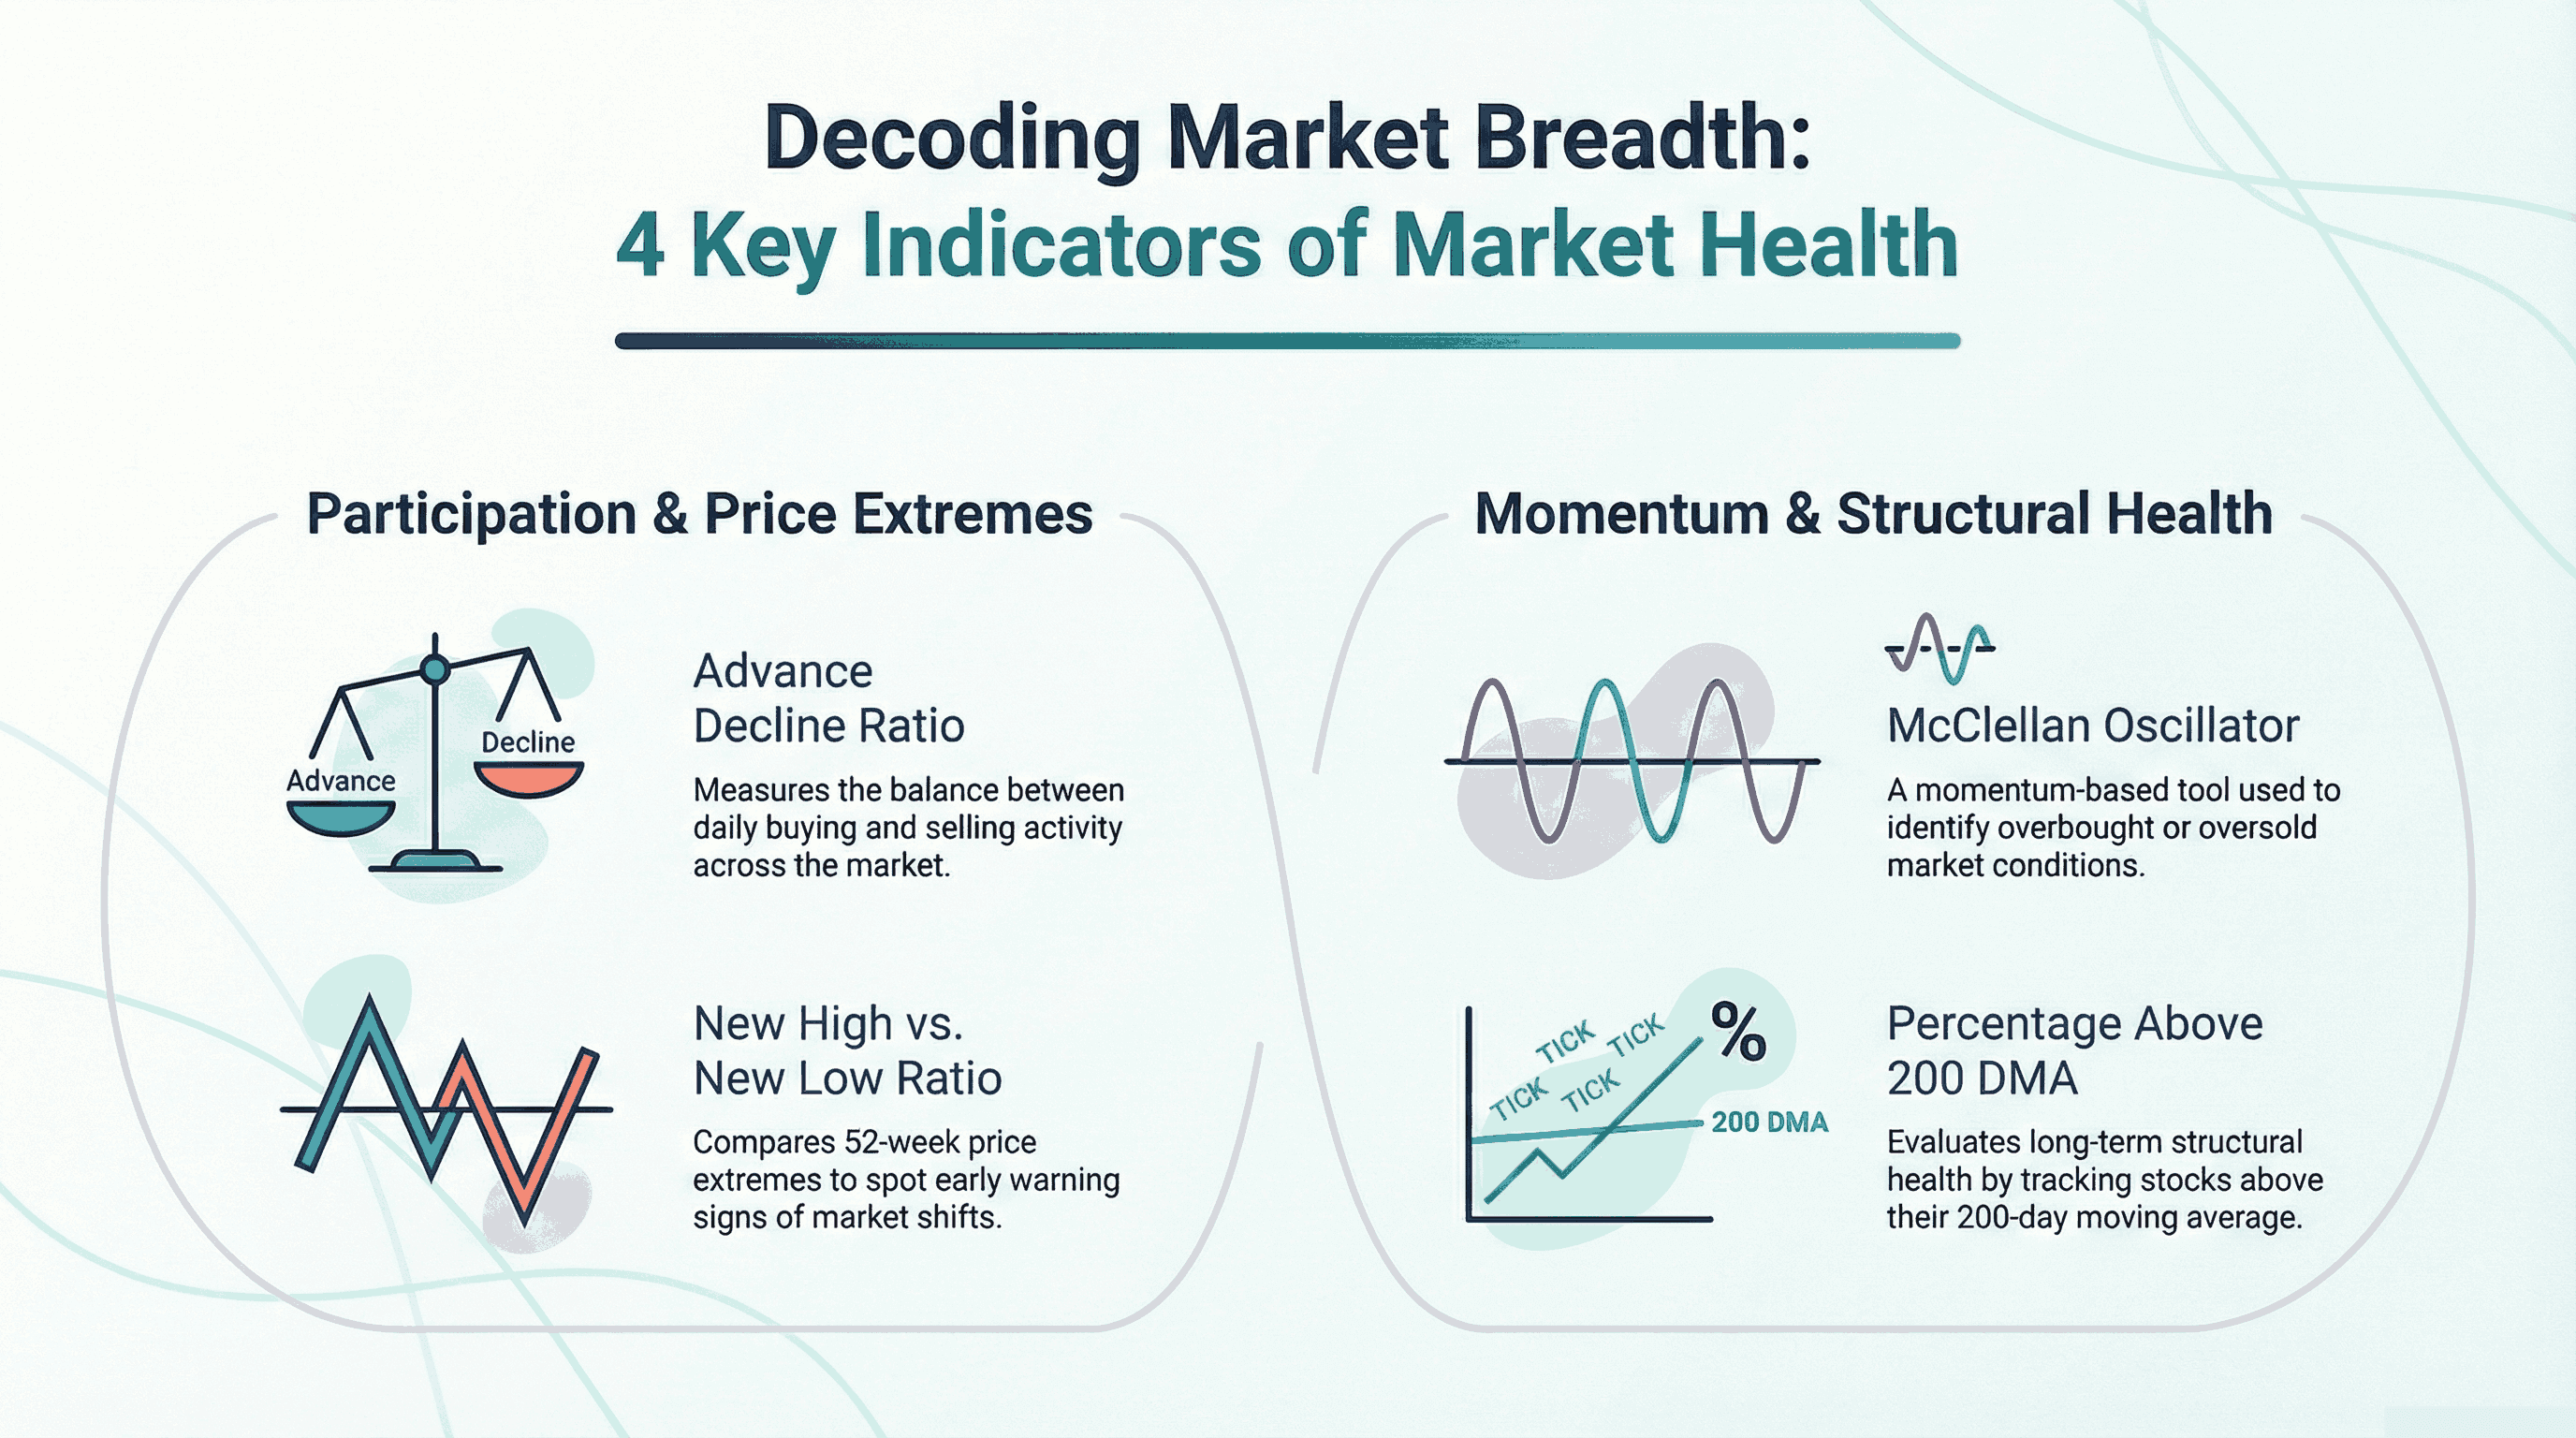
1. Advance Decline Ratio
The advance-decline ratio is a numerical indicator of the balance between buying and selling activity across the market. It is calculated by dividing the total number of advancing stocks by the total number of declining stocks during a single trading session, and is expressed as a simple ratio.
For example, if 1,200 stocks rise and 800 fall, the ratio would be 1.5 (1200 ÷ 800).
It accumulates on the Cumulative advance decline line over time, which is a running total of the daily difference between advancing and declining stocks. Instead of showing a single day’s reading, it tracks participation trends over time, helping investors see whether market strength is expanding or narrowing.
2. New High vs New Low Ratio
The new highs vs lows index compares the number of stocks making new 52-week highs to those making new 52-week lows. It indicates whether stocks are breaking into fresh upward territory or falling to new lows. Unlike the advance-decline ratio, which measures daily movement, this indicator focuses on longer-term price extremes.
It is a good tool, as it helps investors spot early warning signs before larger market moves unfold. The rule of thumb is that when several stocks are hitting new highs, there is a strong buying interest. On the other hand, if new lows increase while the index remains stable, it signals hidden weakness.
3. McClellan Oscillator
The McClellan oscillator India is a momentum-based market breadth indicator. It is derived from exponential moving averages of advancing and declining stocks. It is plotted as a line that fluctuates around the zero level. It is mostly used to identify potential overbought or oversold conditions and to detect early shifts in overall market direction.
Positive readings of the oscillator suggest that the internal momentum is strengthening, while negative readings indicate that participation is weakening. It is worth noting that, because it applies smoothing techniques to breadth data, it reacts more quickly to short-term shifts in participation.
4. Percentage of Stocks Above 200 DMA
The percentage of Stocks Above 200 DMA is mostly used by long-term investors as it measures the proportion of stocks trading above their 200-day moving average (200 DMA), a long-term trend benchmark. Unlike ratios or oscillators, this tool is expressed as a percentage.
For example, if 70 out of 100 stocks are trading above their 200 DMA, the reading would be 70%.
A high percentage suggests broad long-term strength across the market. If the index remains steady but the percentage declines, it may indicate narrowing participation. This makes it an important component of stock market breadth analysis for evaluating structural market health.
How Breadth Predicts Market Reversals
A market reversal is a shift in the overall trend direction. So when a rising market turns into a sustained decline, or a falling market begins a new upward trend, it's a market reversal. It is unlike short-term pullbacks, as they signal bigger changes in market sentiment and momentum. Tracking them early will help you manage your risk, protect your capital, and avoid being caught on the wrong side of a major move.
The thing about reversals is that they often begin internally before they appear in index prices. For example, if indices keep rising but the advance-decline line trends downward, fewer stocks are supporting the rally, which is a warning sign of weakening participation. Tools like the breadth thrust indicator and the Arms Index (TRIN) help detect shifts in market participation metrics, offering early clues that a trend may be losing strength.
Should Long-Term Investors Track Breadth?
No matter if you are short term trader or are in it for the long game, you should always check market breadth indicators. However, if you are a long-term investor, it becomes exponentially more important. While the indicators may not trade daily movements, they will provide you with context during major market cycles.
The key is to remember that broad participation during rallies suggests a healthy bull market, whereas narrow participation during long advances may signal caution. Keeping an eye out for the same will help you in making informed decisions without reacting emotionally to short-term volatility.
Conclusion
Market breadth indicators shift your focus from surface-level index moves to what is actually happening underneath. An index can rise because a handful of heavyweight stocks are doing well. But when participation is broad, when more stocks are advancing, making new highs, and holding above long-term averages, that is when market strength is real.
Here’s the thing. Sustainable bull markets are built on wide participation. Narrow rallies often fade. By tracking tools like the advance-decline line, new highs vs new lows, or the percentage of stocks above the 200 DMA, investors gain context. They are no longer reacting only to price. They are reading internal momentum, participation, and structural health.
For investors building long-term portfolios, this context matters. Equity exposure works best when supported by strong breadth. And when participation weakens, it may be a cue to rebalance, diversify, or manage risk more consciously.
This is where platforms like Grip Invest can complement your strategy. While breadth indicators help you assess equity market strength, Grip Invest provides access to curated fixed-income and alternative investment opportunities that can add stability and predictable cash flows to your portfolio. Combining informed equity exposure with disciplined income allocation can help create a more resilient investment approach across market cycles.
FAQs
1. What is the advance decline ratio?
The advance decline ratio India is a breadth indicator that compares the number of rising stocks to falling stocks in the Indian market. It is calculated by dividing the number of advancing (rising) stocks by the number of declining (falling) stocks during a specific trading period. A value above 1 suggests more stocks are advancing, while a value below 1 indicates broader weakness.
2. How to measure market strength?
Market strength can be measured using several breadth indicators such as the advance-decline line, new highs lows index, McClellan Oscillator, and percentage of stocks above key moving averages.
3. Are breadth indicators reliable?
While market breadth indicators are useful tools for market analysis, they become even more accurate and reliable when combined with price analysis and other tools. They help confirm trends and highlight early warning signs. It is usually not advised to use them alone to predict exact turning points.
Want to stay at the top of your finances?
Join the community of 4 lakh+ investors and learn more about Grip Invest, the latest financial knick-knacks, and shenanigans in the world of investing.
Happy Investing!
Disclaimer - Investments in debt securities/municipal debt securities/securitised debt instruments are subject to risks including delay and/ or default in payment. Read all the offer related documents carefully. The investor is requested to take into consideration all the risk factors before the commencement of trading.
This communication is prepared by Grip Broking Private Limited (bearing SEBI Registration No. INZ000312836 and NSE ID 90319) and/or its affiliate/ group company(ies) (together referred to as “Grip”) and the contents of this disclaimer are applicable to this document and any and all written or oral communication(s) made by Grip or its directors, employees, associates, representatives and agents. This communication does not constitute advice relating to investing or otherwise dealing in securities and is not an offer or solicitation for the purchase or sale of any securities. Grip does not guarantee or assure any return on investments and accepts no liability for consequences of any actions taken based on the information provided. For more details, please visit www.gripinvest.in
Registered Address - 106, II F, New Asiatic Building, H Block, Connaught Place, New Delhi 110001


