
Debt To Equity Ratio Explained: Formula, Meaning And Examples


Debt can help a company grow faster. It can fund a new factory, support working capital, finance expansion or help a business enter a larger market.
When used well, debt gives a company more room to scale without raising fresh capital from shareholders.
But debt also brings a fixed obligation. Interest must be paid. The principal must be repaid. This is where leverage becomes important in financial analysis.
A company may look profitable on paper, but if it carries too much debt, its financial position can become fragile during a slowdown. The debt to equity ratio helps readers spot that pressure early.
What Is The Debt To Equity Ratio?
To understand leverage, start with one basic question: how much of the business is funded by borrowed money compared with shareholder capital?
The debt-to-equity ratio answers this question.
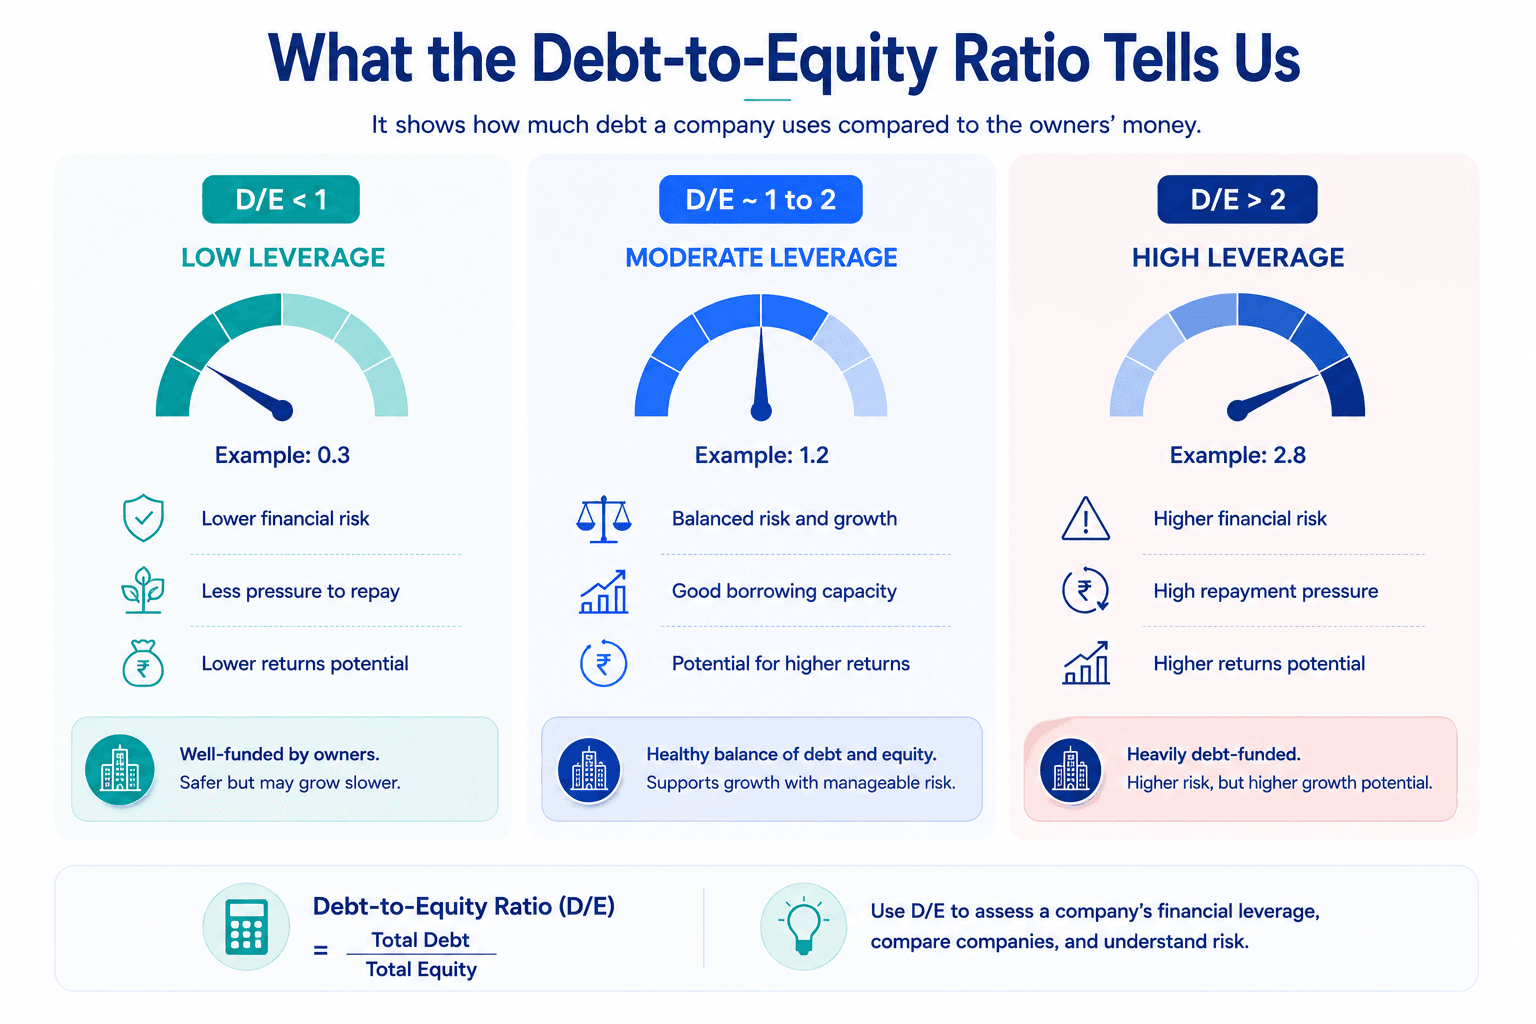
It measures how much debt a company uses for every unit of shareholders’ equity. In simple terms, it shows the balance between money borrowed from lenders and money that belongs to shareholders.
For example, if a company has a debt-to-equity ratio of 1, it means the company has INR 1 of debt for every INR 1 of equity. If the ratio is 2, it carries INR 2 of debt for every INR 1 of equity.
This is why investors and lenders track it closely. Investors use it to understand financial risk. Lenders use it to judge whether the company has enough equity cushion to support further borrowing.
The ratio does not give a final verdict. It gives a starting point.
A high ratio does not automatically make a company weak. A low ratio does not automatically make it strong. The real reading begins when you connect the ratio with cash flow, interest cost, sector norms, and the company’s stage of growth.
Once that meaning is clear, the next step is to see how the ratio is calculated.
Formula And Calculation
The standard formula is simple:
Debt to Equity Ratio = Total Debt / Shareholders’ Equity
In many basic explainers, “debt” may be taken as total liabilities. Some analysts use this broader version because liabilities also show what the company owes. Investopedia describes D/E as a ratio that compares total liabilities with shareholder equity, while analysts may also adjust it to isolate short-term or long-term debt for a clearer risk view.
Now let us put the formula into a simple example.
Assume a company has the following numbers on its balance sheet:
Particulars | Amount |
Short-term debt | INR 40 crore |
Long-term debt | INR 160 crore |
Total debt | INR 200 crore |
Shareholders’ equity | INR 250 crore |
Now apply the formula:
Debt to Equity Ratio = INR 200 crore / INR 250 crore
Debt to Equity Ratio = 0.8
This means the company carries INR 0.80 of debt for every INR 1 of equity.
At first glance, this may look moderate. But the number needs context. A power company may handle this ratio comfortably because its cash flows may be more predictable. A cyclical manufacturing company may find the same ratio more demanding if orders fall.
So, the calculation is only the first layer. The real work begins with interpretation
Interpreting D/E Ratio
A debt-to-equity ratio should never be read in isolation.
The same ratio can tell different stories in different sectors. It can signal discipline in one business and stress in another. That is why interpretation needs both numbers and judgement.
What A High Debt To Equity Ratio May Mean?
A high ratio means the company uses more borrowed funds compared with equity.
This can support growth. It can also raise financial risk. The difference depends on what the company does with the debt and whether its cash flows can support repayment.
A high D/E ratio may suggest:
- Higher interest burden
- Greater repayment pressure
- More sensitivity to interest rate changes
- Lower flexibility during downturns
- Higher refinancing risk
- Possible stress on credit profile
Consider a cement company that borrows INR 1,000 crore to expand capacity.
If demand remains steady, the new plant can lift revenue and improve operating scale. But if construction demand slows, the company still has to pay interest. In that case, the same debt begins to look less like expansion capital and more like a pressure point.
This is the fault line of leverage. Debt can accelerate growth when revenue holds up. It can compress the room for error when business conditions change
What A Low Debt To Equity Ratio May Mean?
A low ratio means the company relies less on borrowings.
This often signals a more conservative balance sheet. The company may have lower repayment pressure and more flexibility during difficult periods.
A low D/E ratio may suggest:
- Lower financial risk
- Stronger equity base
- More borrowing capacity
- Lower interest burden
- Conservative capital allocation
But low debt is not always a virtue.
A company with stable cash flows and strong growth opportunities may choose to borrow sensibly instead of diluting shareholders. If it avoids debt completely, it may also underuse its balance sheet.
Take a mature consumer company with steady demand and healthy margins. If it has very low debt, that may show prudence. But if it keeps missing expansion opportunities because it refuses all borrowing, investors may question whether capital is being used well.
So, high and low are not moral labels. They are signals that need context.
That context often begins with the industry.
There is no single “healthy” debt-to-equity ratio for all companies.
A technology company, a bank, a utility, and a real estate firm have very different capital needs. Some businesses need factories, networks, land, or large infrastructure. Others can grow with limited physical assets.
A D/E ratio that looks high for a software company may look routine for an infrastructure company. The reader should always ask: Does the business generate steady cash flows to carry this debt?
Benefits And Limitations Of Tracking D/E
Once the context is clear, the ratio becomes a useful screening tool.
It helps readers understand how a company funds its operations. It also shows whether growth depends more on shareholder capital or borrowed money.
Key benefits include:
1. It shows capital structure clearly: The ratio reveals whether the company leans more on debt or equity.
2. It helps assess financial risk: More borrowing usually means more fixed repayment pressure.
3. It supports peer comparison: The ratio works well when comparing companies in the same sector.
4. It gives lenders a risk cue: A high ratio may make fresh borrowing harder or costlier.
5. It helps track leverage over time: A rising trend can show whether the company is taking on more financial risk.
The debt to equity ratio is useful, but it is not omniscient.
It does not show the interest rate on borrowings. It does not reveal when debt is due. It also does not prove that profits are turning into cash.
Key limitations include:
1. It does not show interest cost: Two companies can have the same ratio but very different borrowing rates.
2. It misses repayment timing: Debt due soon can create pressure even when total debt looks manageable.
3. It can mislead across sectors: A utility and a software company cannot be judged by the same yardstick.
4. It depends on accounting values: Losses, buybacks or write-offs can reduce equity and lift the ratio.
5. It may miss hidden pressure: Lease commitments and contingent liabilities need separate review.
6. It does not measure cash quality: Reported profit does not always mean strong cash flow.
Debt To Equity vs Debt Ratio
Both ratios study leverage. But they ask different questions.
The debt to equity ratio compares debt with shareholder capital. Debt ratio compares debt with total assets.
Corporate Finance Institute also explains that the D/E ratio uses equity as the denominator, while the debt-to-assets ratio uses total assets.
| Basis | Debt to Equity Ratio | Debt Ratio |
| Formula | Total debt / Shareholders’ equity | Total debt / Total assets |
| What it compares | Debt against equity | Debt against assets |
| Main question | How much debt supports each unit of equity? | How much of the asset base is debt-funded? |
| Best used for | Capital structure analysis | Asset funding analysis |
| Higher ratio means | More debt relative to equity | More assets funded through debt |
| Limitation | Can rise sharply when equity falls | Does not show equity cushion as clearly |
Let us use one example.
Assume a company has:
- Total debt: INR 300 crore
- Shareholders’ equity: INR 200 crore
- Total assets: INR 700 crore
Debt to equity ratio = INR 300 crore / INR 200 crore = 1.5
Debt ratio = INR 300 crore / INR 700 crore = 0.43
The D/E ratio shows that debt is 1.5 times equity. The debt ratio shows that 43% of assets are funded through debt.
Both are useful. They simply look at leverage from different angles.
But the ratio should not be used alone.
It becomes more useful when read with interest coverage, operating cash flow, sector norms, debt maturity, and return on capital. That is when it moves from a textbook formula to a practical financial risk tool.
Debt can help a business expand. It can also make the same business vulnerable.
The debt-to-equity ratio helps readers see which direction the balance sheet may be moving.
Conclusion
The debt to equity ratio is one of the simplest ways to understand how a company finances its operations and growth. By comparing borrowed funds with shareholder capital, the ratio helps investors evaluate financial leverage, risk, and balance sheet strength. However, no ratio should be viewed in isolation. A meaningful analysis also considers cash flows, interest coverage, industry norms, profitability, and the company's growth stage.
Whether a ratio appears high or low, the real question is whether the business can comfortably manage its obligations while creating value for shareholders. Used alongside other financial metrics, the debt to equity ratio can provide valuable insight into a company's financial health and long-term stability.
For investors looking beyond equity analysis, Grip Invest offers access to corporate bonds, fixed income products, and alternative investment opportunities that can help build a diversified portfolio across different risk and return profiles.
FAQs On Debt To Equity Ratio
Author: Grip Invest Editorial Team The Grip Invest Editorial Team is a group of Chartered Accountants, MBA (Finance) graduates, and Qualified Research Analysts dedicated to helping you invest smarter. We dive deep into India's fixed income landscape to deliver content that is accurate, up-to-date, and easy to understand. Whether you're exploring bonds, fixed deposits, or other fixed income opportunities, our guides cut through the noise and give you the clarity to make better financial decisions. |
Want to stay at the top of your finances?
Join the community of 4 lakh+ investors and learn more about Grip Invest, the latest financial knick-knacks, and shenanigans in the world of investing.
Happy Investing!
Disclaimer - Investments in debt securities/municipal debt securities/securitised debt instruments are subject to risks including delay and/ or default in payment. Read all the offer related documents carefully. The investor is requested to take into consideration all the risk factors before the commencement of trading.
This communication is prepared by Grip Broking Private Limited (bearing SEBI Registration No. INZ000312836 and NSE ID 90319) and/or its affiliate/ group company(ies) (together referred to as “Grip”) and the contents of this disclaimer are applicable to this document and any and all written or oral communication(s) made by Grip or its directors, employees, associates, representatives and agents. This communication does not constitute advice relating to investing or otherwise dealing in securities and is not an offer or solicitation for the purchase or sale of any securities. Grip does not guarantee or assure any return on investments and accepts no liability for consequences of any actions taken based on the information provided. For more details, please visit www.gripinvest.in
Registered Address - 106, II F, New Asiatic Building, H Block, Connaught Place, New Delhi 110001


