
Nifty 50 vs Nifty 500: Performance, Returns And Key Differences


Indices like Nifty 50 and Nifty 500 act as benchmarks that reveal keen insights into the performance of stock market segments or the market as a whole.
Not only do they help gauge market and economic trends, but they also set standards against which the performance of different market-linked instruments can be analysed to make optimal investment decisions. This blog upholds a Nifty 50 vs Nifty 500 comparative analysis, based on their essence, constituents, returns, and more.
What Is The Nifty 50?
Launched in 1996 by the National Stock Exchange, the Nifty 50 is the flagship stock market index in India.1 As the name suggests, the Nifty 50 index consists of the top 50 largest company stocks by free float market capitalisation on the National Stock Exchange. Therefore, it primarily represents and tracks the performance of large-cap, blue-chip company stocks across sectors.
As of 30 April 2026, the top five sectors by weight are Financial Services, Oil, Gas and Consumer Fuel, Information Technology, Automobile and Auto Components, and Fast Moving Consumer Goods, illustrated in the graph below.
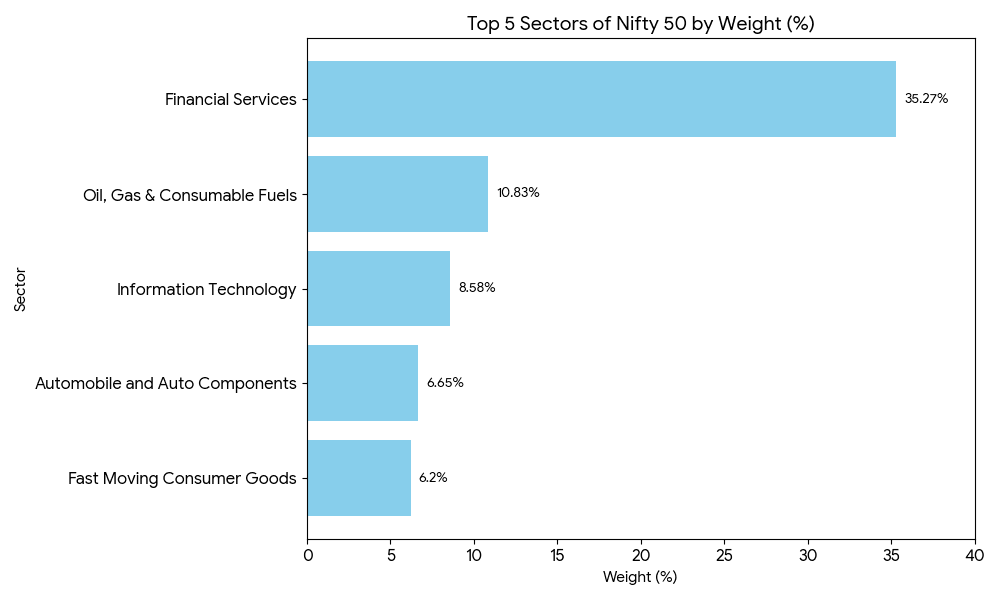
The sector wise distribution represents the main industries in which the Nifty 50 is invested, providing keen trend insights to investors. Nifty 50 reviews and rebalances its holdings semi-annually, on the last working day of March and September, to replace underperforming stocks and make necessary adjustments based on dynamic trends.2
The table below shows the top 5 company stocks held by the index as of 30 April 2026, along with their weightage.
| Stock Name | Weightage |
| HDFC Bank Ltd. | 10.73% |
| Reliance Industries Ltd. | 8.78% |
| ICICI Bank Ltd. | 8.21% |
| Bharti Airtel Ltd. | 5.26% |
| Larsen & Toubro Ltd. | 4.28% |
While one of the primary purposes of the Nifty 50 index is to reveal market trends, it also acts as a diversification reference to individual investors and institutional investors like mutual funds, index funds, etc. Investors can either try to track and replicate Nifty 50 returns and composition or outperform it.
Let us now closely analyse the next leg of the Nifty 50 vs Nifty 500 comparison, but understanding the Nifty 500.
What Is The Nifty 500?
The Nifty 500 is a broad-based index which constitutes and represents the top 500 company stocks by free float market capitalisation on the National Stock Exchange.3 Due to such a massive portfolio pool, this index gives an overall market overview, as it includes large-cap, mid-cap, and small-cap segments across different industries.
As of 30 April 2026, the top five sectors by weightage that are represented in the Nifty 500 index are Financial Services, Oil, Gas & Consumable Fuels, Capital Goods, Automobile and Auto Components, and Healthcare, as illustrated below.
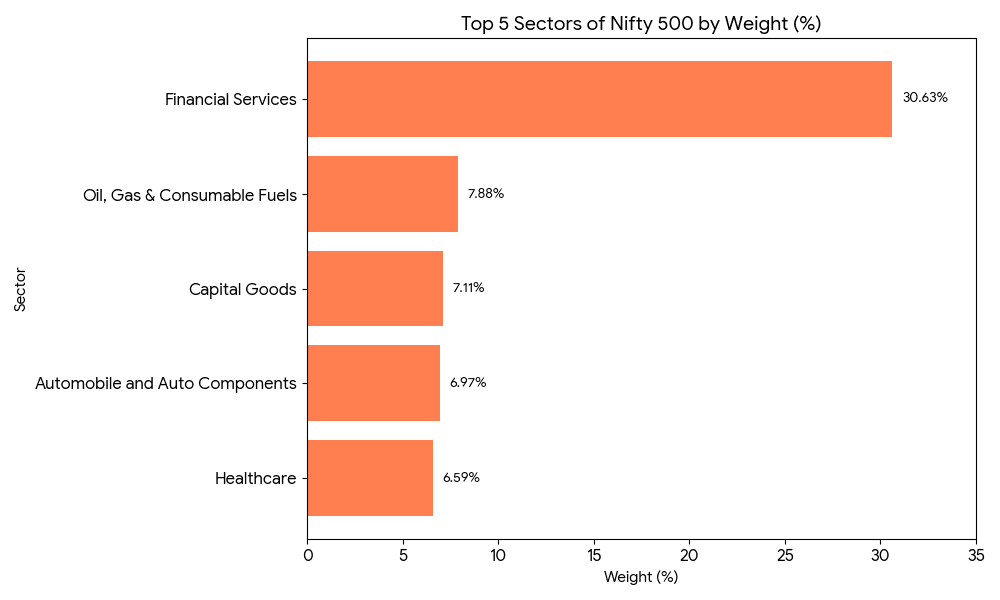
The reports of 30 March 2026 reveal that the Nifty 500 index represents approximately 92.04% of the total free float market capitalisation of stocks on NSE.4
Therefore, trends and patterns highlighted by this index reveal keen insights not only about a particular stock category but the market as a whole.
The table below shows the top 5 stocks in the Nifty 500 index composition as of 30 April 2026.
| Stock Name | Weightage |
| HDFC Bank Ltd. | 6.09% |
| Reliance Industries Ltd. | 4.98% |
| ICICI Bank Ltd. | 4.66% |
| Bharti Airtel Ltd. | 2.99% |
| Larsen & Toubro Ltd. | 2.43% |
ccording to the latest 2024 whitepaper, there are over 1900 companies on the NSE Mainboard.5 Furthermore, the top 100 stocks by market capitalisation are categorised as large-cap, the next 150 as mid-cap, and the subsequent 250 as small-cap, while the remaining are micro-cap stocks. Therefore, since Nifty 500 lists the top 500 company stocks, it is expected to represent the total market trend, including large-cap, mid-cap, and small-cap stocks.
Therefore, Nifty 50 vs Nifty 500 performance vary immensely due to a substantial distinction in their composition, features, and other nuances.
Nifty 500 vs Nifty 50 Returns: Performance Comparison
Analysing the return patterns and other performance indicators of Nifty 50 and Nifty 500 over different tenures reveals keen insights, necessary for investment decision-making.
As of 8 May 2026, the Nifty 50 one-year return stands in red at -1.05%.6 However, the performance of the index over 5 years and 10 years is positive and showcases significant growth. The return over 5 years is at 63.17%, and that over 10 years is 213.26%. The graph below shows the 10-year performance graph of the Nifty 50.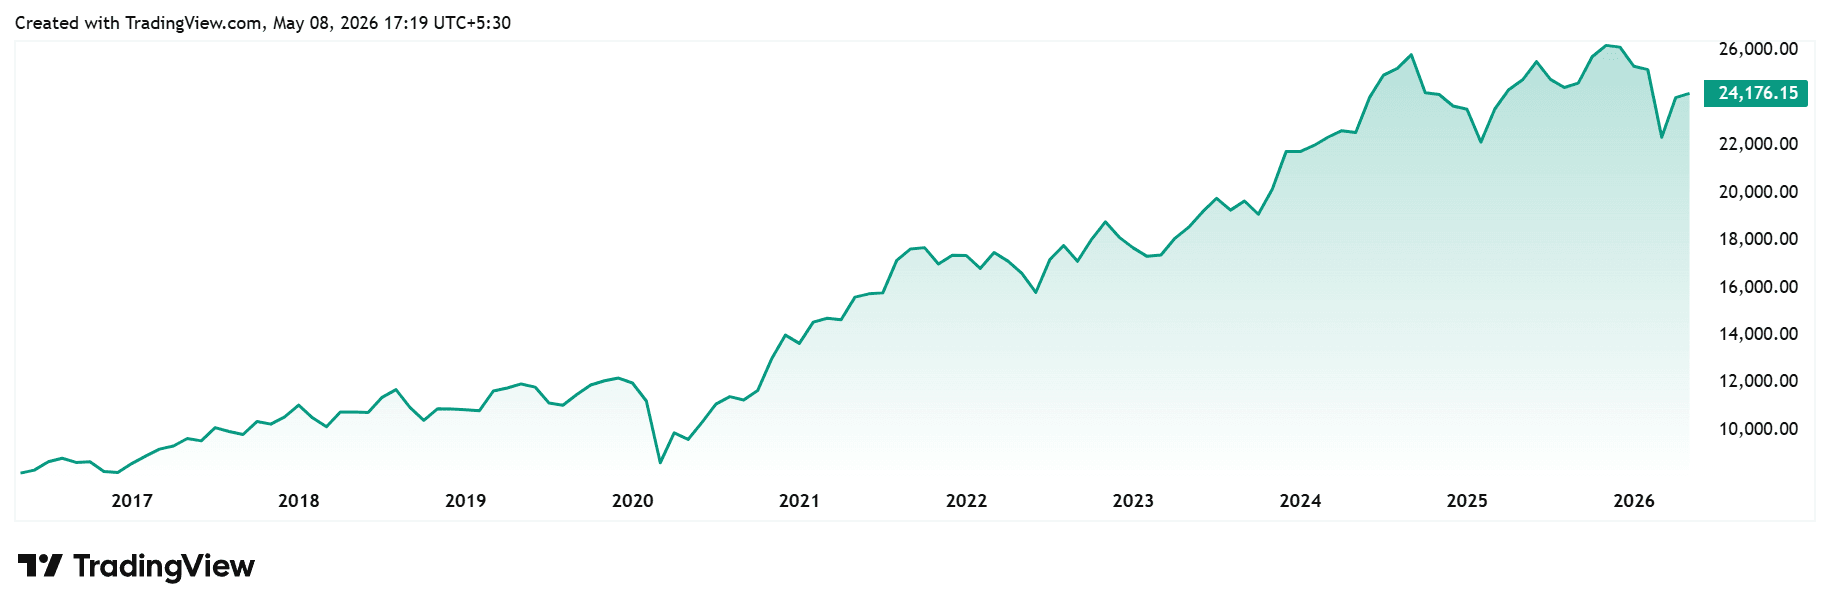
Source: TadingView
In the case of the Nifty 500 index, as of 8 May 2026, the one-year, five-year, and ten-year performance remains positive.7 The one-year return stands at 4.55%, while the five-year return is at 83.75%. Over 10 years, the index has delivered a 256.26% return. Therefore, the performance of the Nifty 500 stock has been more than that of the Nifty 50. The heightened return can be expected to be driven by the mid-cap and small-cap stocks. The graph below shows the Nifty 500 performance over 10 years.
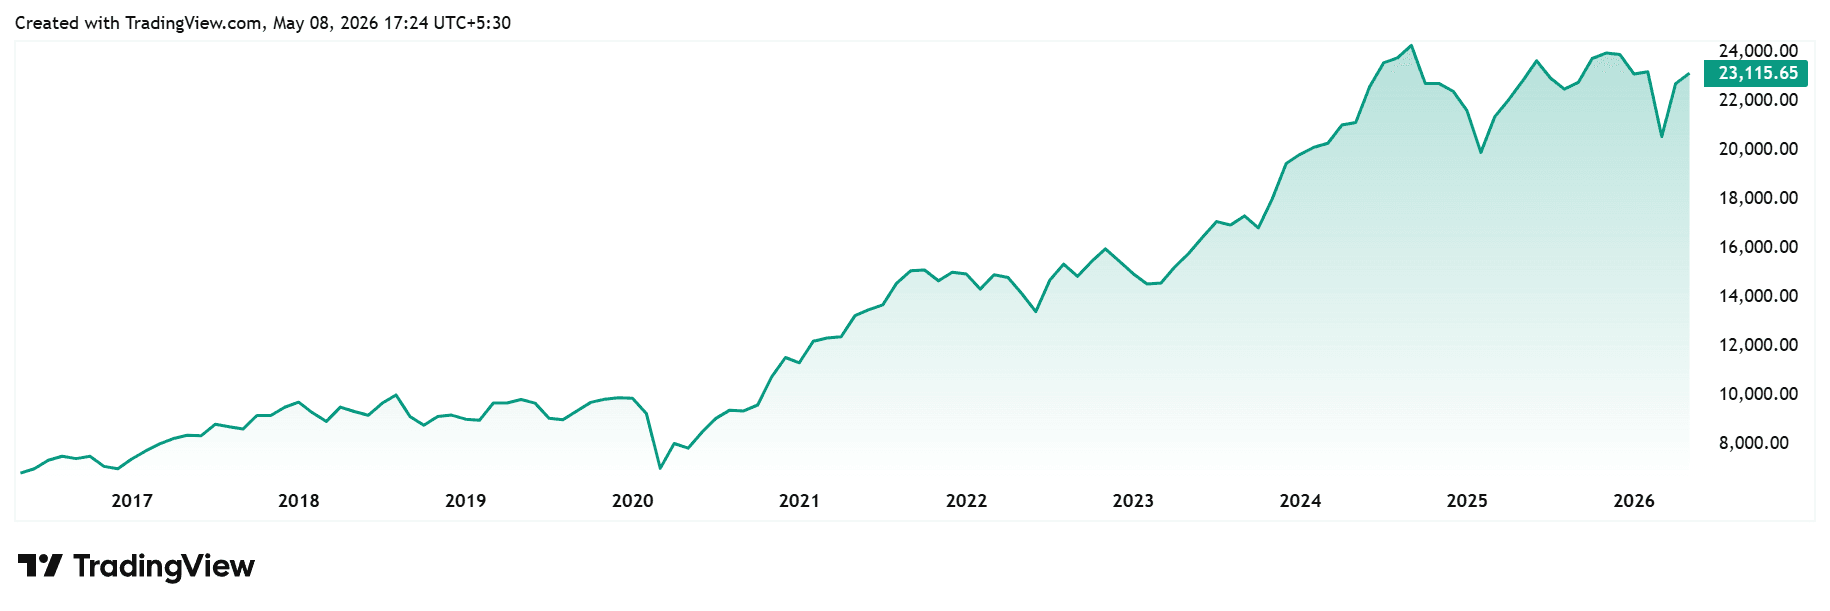
Source: Trading View
While the P/E Ratio of Nifty 50 is at 21.16, that of Nifty 500 is at 23.65.8,9 The higher P/E ratio of the Nifty 500 might indicate the investor's anticipation of high future growth. This aligns with the theoretical understanding that large-cap stocks that are the constituents of Nifty 50 are blue-chip and have achieved significant growth, while Nifty 500 also includes mid-cap and small-cap stocks, which are growth stocks.
These indices play a very important role for mutual fund houses and their investors.
Nifty 50 vs Nifty 500 For Mutual Fund Investors
Mutual funds track a particular benchmark either to outperform it or to match its performance. Active mutual funds aim to deliver greater returns than the benchmark index, while passive funds aim to deliver similar returns as the benchmark. Funds choose a benchmark to track based on their nature and portfolio structure.
Large-cap funds that invest 80% of their total assets in large-cap equities and related assets have the Nifty 50 as their benchmark, since the index invests in the top 50 company stocks based on market capitalisation.
On the other hand, flexi-cap and multi-cap funds that invest in a mix of large-cap, mid-cap, and small-cap stocks have the Nifty 500 as their benchmark.
Now, the question arises as to which Nifty index is best.
Volatility Comparison: Which Is Safer During Market Corrections
The security of an investment medium is put to the test the most during market corrections and volatility. Given that Nifty 50 invests mostly in large-cap stocks, they are expected to have greater stability compared to Nifty 500, which invests in growth-oriented mid-cap and small-cap stocks. However, given the dynamic nature of the market, no asset is completely risk-free.
Therefore, investors should prioritise diversification. Along with equity investment, investors should also prioritise fixed-income assets like corporate bonds that deliver predictable returns and stable portfolio growth.
Conclusion
Nifty 50 and Nifty 500 represent two different approaches to market exposure. While Nifty 50 focuses on stable large-cap companies, Nifty 500 provides broader exposure across large-cap, mid-cap, and small-cap stocks, offering higher growth potential with relatively higher volatility.
The right choice depends on your risk appetite, return expectations, and investment horizon. Investors should also diversify beyond equities with fixed-income assets like corporate bonds to maintain portfolio stability during market fluctuations.
Explore fixed-income investment opportunities and diversify your portfolio with Grip Invest today.
FAQs On Nifty 50 Vs Nifty 500
Author: Grip Invest Editorial Team The Grip Invest Editorial Team is a group of Chartered Accountants, MBA (Finance) graduates, and Qualified Research Analysts dedicated to helping you invest smarter. We dive deep into India's fixed income landscape to deliver content that is accurate, up-to-date, and easy to understand. Whether you're exploring bonds, fixed deposits, or other fixed income opportunities, our guides cut through the noise and give you the clarity to make better financial decisions. |
Want to stay at the top of your finances?
Join the community of 4 lakh+ investors and learn more about Grip Invest, the latest financial knick-knacks, and shenanigans in the world of investing.
Happy Investing!
Disclaimer - Investments in debt securities/municipal debt securities/securitised debt instruments are subject to risks including delay and/ or default in payment. Read all the offer related documents carefully. The investor is requested to take into consideration all the risk factors before the commencement of trading.
This communication is prepared by Grip Broking Private Limited (bearing SEBI Registration No. INZ000312836 and NSE ID 90319) and/or its affiliate/ group company(ies) (together referred to as “Grip”) and the contents of this disclaimer are applicable to this document and any and all written or oral communication(s) made by Grip or its directors, employees, associates, representatives and agents. This communication does not constitute advice relating to investing or otherwise dealing in securities and is not an offer or solicitation for the purchase or sale of any securities. Grip does not guarantee or assure any return on investments and accepts no liability for consequences of any actions taken based on the information provided. For more details, please visit www.gripinvest.in
Registered Address - 106, II F, New Asiatic Building, H Block, Connaught Place, New Delhi 110001


