

SIP Returns In India: How Much Can You Earn In 2026?


Mutual fund investments are processed through two modes: a simple lump sum or a disciplined Systematic Investment Plan (SIP). A lump sum investment entails investing a one-off large sum of money. On the other hand, an SIP investment requires investing a fixed amount of money regularly into a mutual fund scheme, in fixed intervals.
SIP investments are popular investment tools across India. Interestingly, it is also the go-to investment mode for Gen Z, with almost 92% preferring this over a regular lump sum investment1. SIP emerges as an attractive investment tool due to its ease and low entry barriers. With the best SIP plans 2026 starting from just INR 500/month, SIP becomes accessible for all kinds of investors.
Before investing in a mutual fund scheme, it is essential to understand the SIP meaning, SIP returns per month, how to use the SIP returns calculator India, and the features of compounding in SIP. This blog is here to help.
How SIP Returns Are Calculated?
Mutual fund SIP returns are calculated taking into consideration your investment amount, duration and expected returns. Since there are different cash flows on separate dates, the Net Asset Value (NAV) or the fair value of the units purchased of the mutual fund also differs.
Consequently, the Extended Internal Rate of Return (XIRR) method is used for calculating the returns on SIP investments. A Compounded Annual Growth Rate (CAGR) method is suitable for a lump sum investment, where there is no regular cash flow.
The XIRR method computes the annual average return of each installment separately. This helps calculate the comprehensive average return.
The ideal technique for calculating SIP returns using the XIRR method is to work your way through an Excel spreadsheet.
An Excel spreadsheet recognises and provides an integral function of XIRR.
Use the formula:
XIRR (Values, Dates, [Guess])
A major contributor to enhancing returns is the compounding feature in SIP. An installment made at a particular time starts compounding from the amount it is invested, till it is redeemed. This means the longer an instalment remains invested, the higher compounding benefits it accumulates. The XIRR method computes a single rate of return for all these different compounding results.
This example demonstrates how compounding works in mutual funds:
A new investor, Amit, wants to invest in a large-cap mutual fund. He is considering an SIP mode for the same. However, he is confused about what returns to expect. Let us check out the returns of the HDFC large-cap fund.
| Returns over | Fund past returns (As of 9th Sep, 2025) | Total Invested Amount with a INR 10,000 monthly SIP | Value of INR 10,000 monthly SIP over the period | Amount of Returns |
| 5 years | 22.10% | INR 6 Lakhs | INR 10.4 Lakhs | INR 4.4 Lakhs |
| 10 years | 14.23% | INR 12 Lakhs | INR 25.2 Lakhs | INR 13.2 Lakhs |
| 15 years | 11.79% | INR 18 Lakhs | INR 46.7 Lakhs | INR 28.7 Lakhs |
Source: MoneyControl2
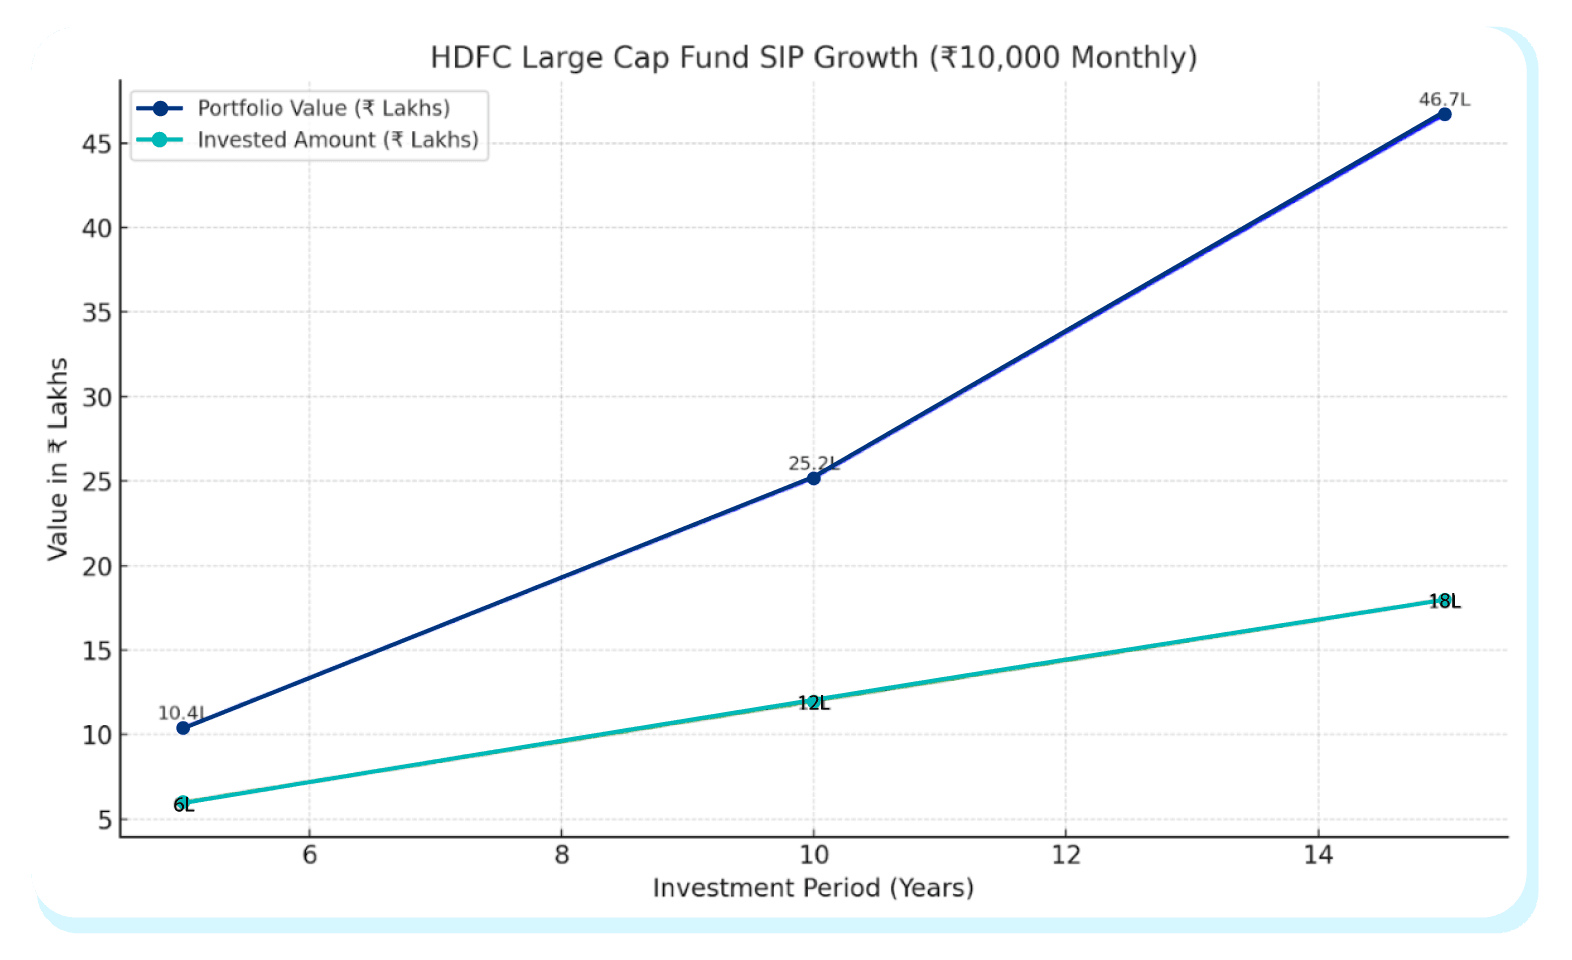
The above SIP example shows the returns of an equity mutual fund. However, Amit is also seeking to begin an SIP investment in a debt fund like Nippon India Credit Risk Fund. Let us see its past returns and the value of a INR 10,000 monthly SIP with returns.
| Returns over | Fund past returns (As of 9th Sep, 2025) | Total Invested Amount with a INR 10,000 monthly SIP | Value of INR 10,000 monthly SIP over the period | Amount of Returns |
| 5 years | 8.75% | INR 6 Lakhs | INR 7.5 Lakhs | INR 1.5 Lakhs |
| 10 years | 6.10% | INR 12 Lakhs | INR 16.4 Lakhs | INR 4.4 Lakhs |
| 15 years | 6.99% | INR 18 Lakhs | INR 31.3 Lakhs | INR 13.3 Lakhs |
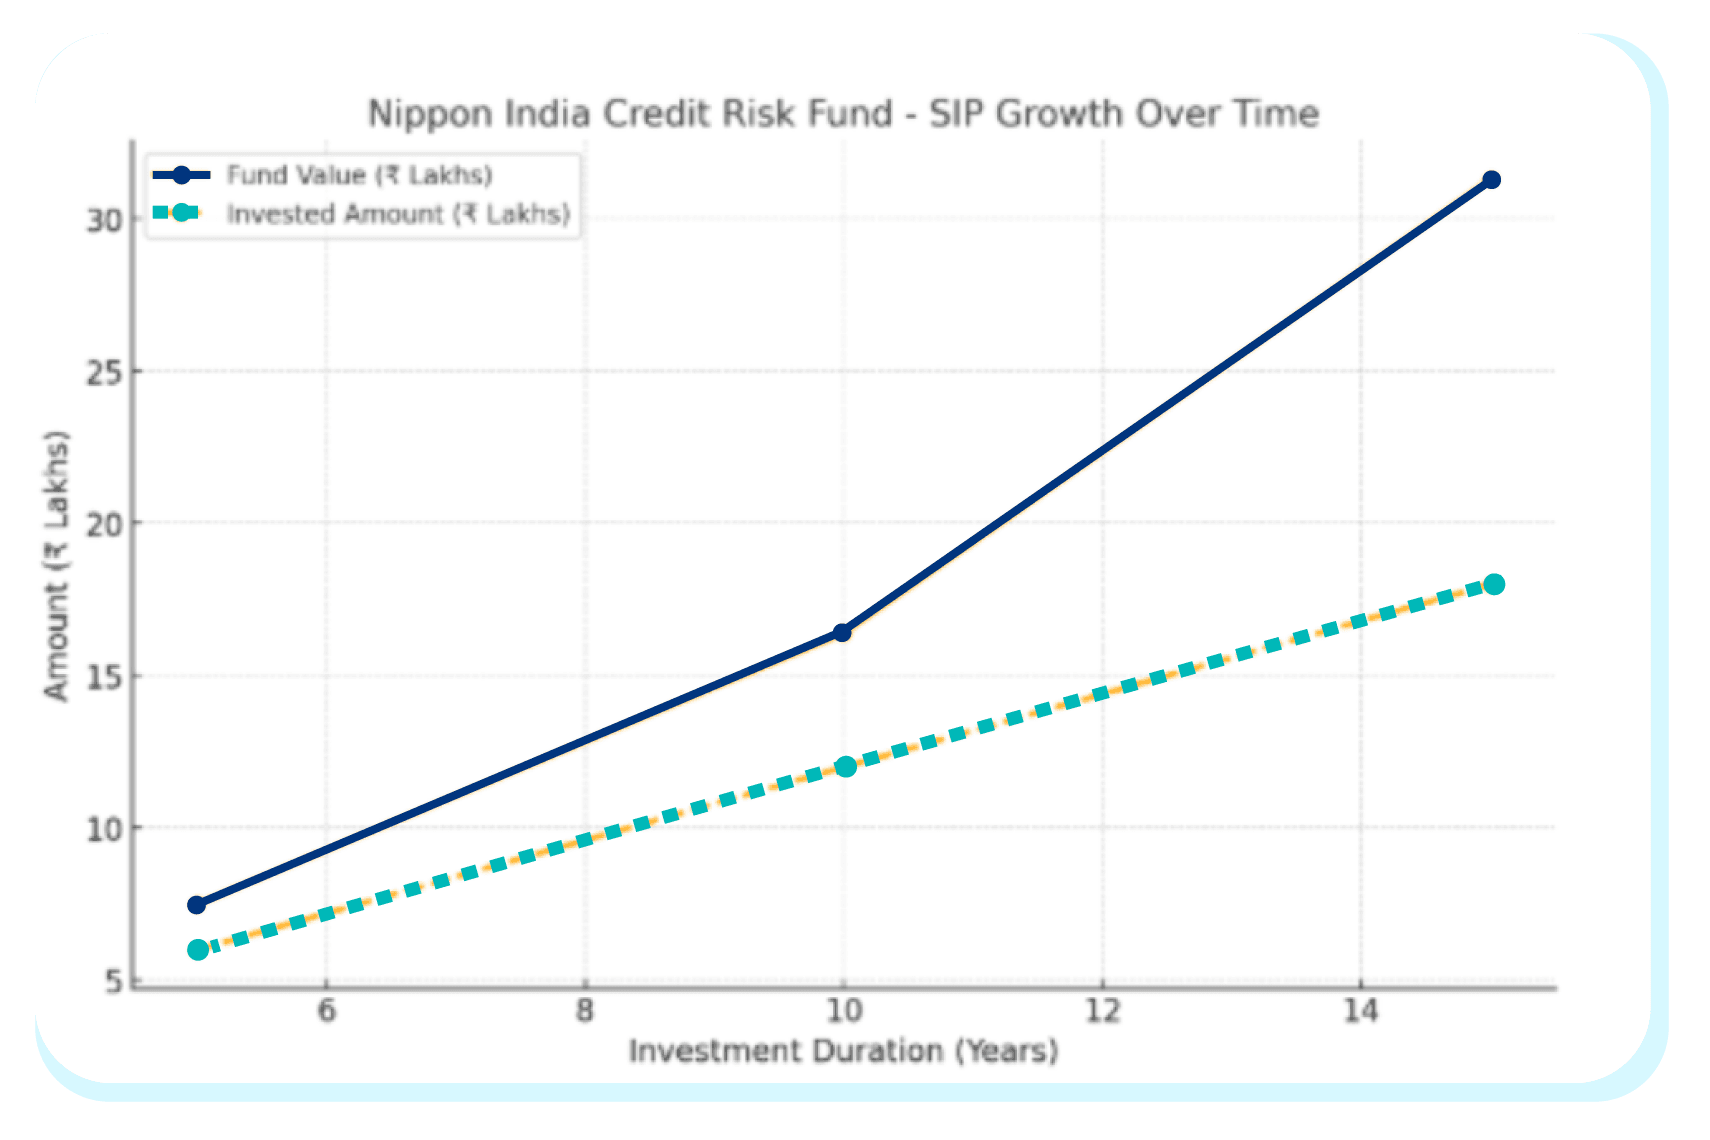
From the above two mutual funds and their SIP returns, it is evident that compounding in SIP works its magic by reinvesting the gains generated over time, so your investment can earn gains on gains. In the long term, the value of investment constitutes a larger component of gains than the invested amount.
Also Read: Best Short-Term Investment Plans for 3 Months
Historical SIP Returns In India
SIP returns vary across equity, debt, and hybrid categories of mutual funds. Here are the category average returns over 3, 5, and 10 years as on 10th September, 2025:
| Category | SIP Returns- 3 years | SIP Returns- 5 years | SIP Returns- 10 years |
| Equity mutual funds | 14% | 18% | 13% |
| Hybrid mutual funds | 10% | 11% | 8% |
| Det mutual funds | 7% | 6% | 6% |
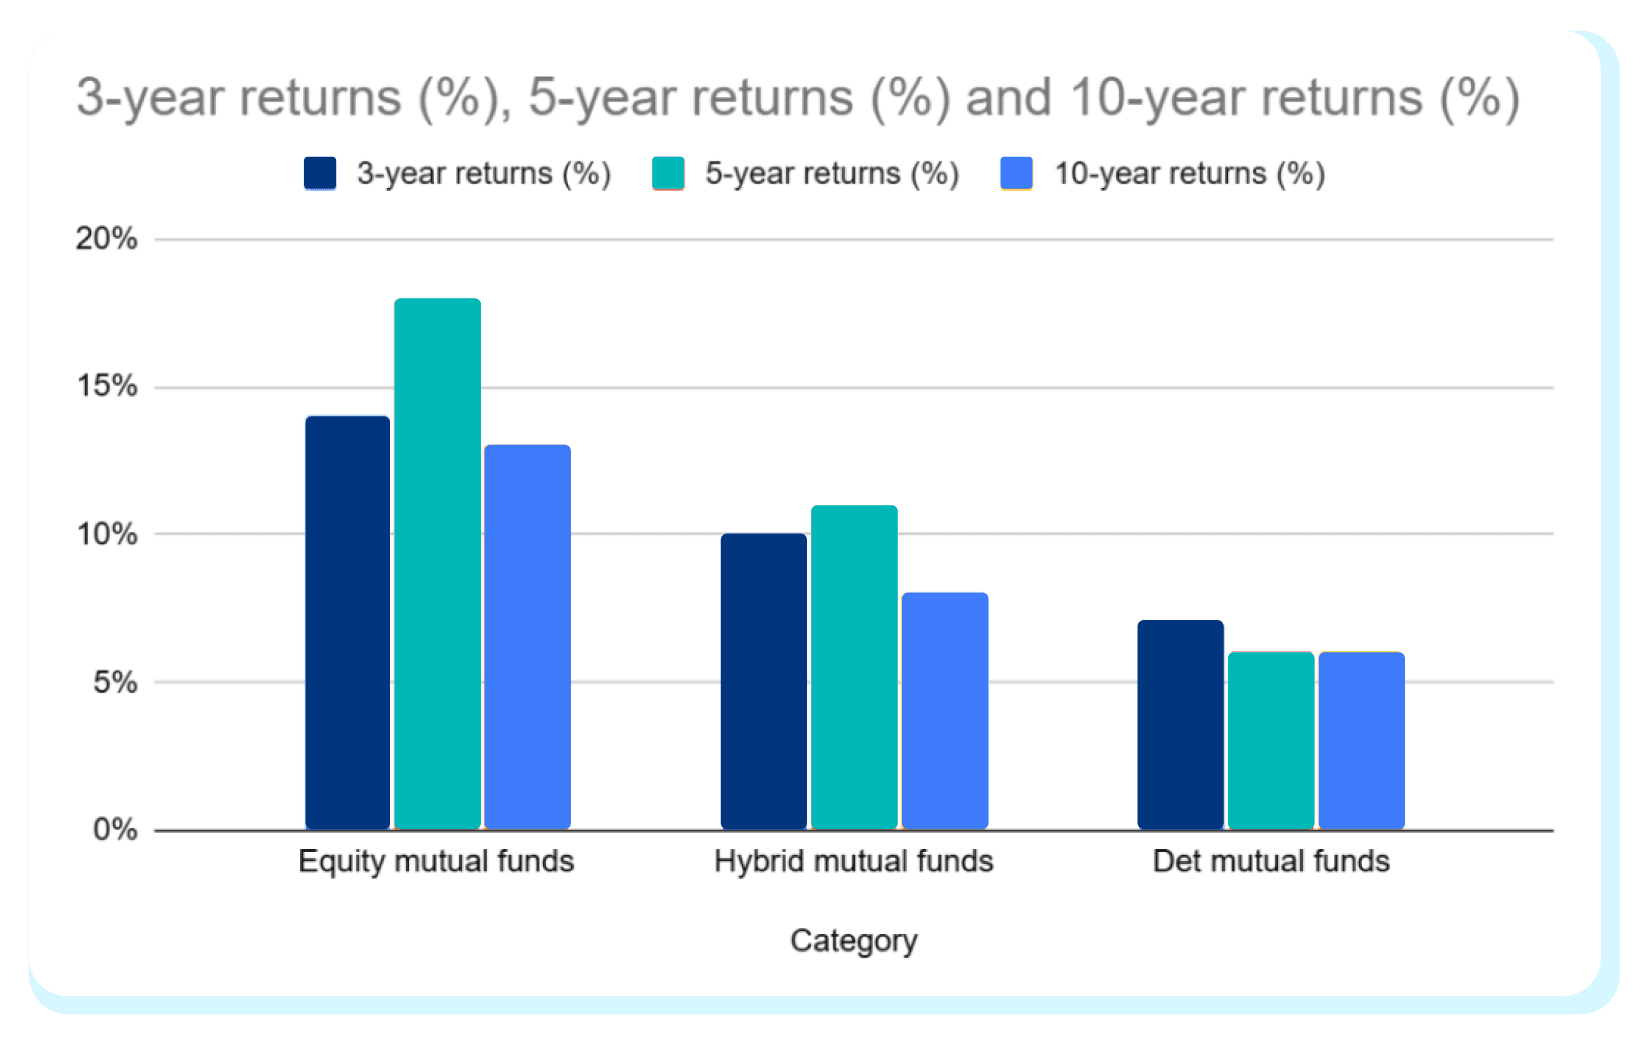
Although past returns are not indicative of future returns, this table illustrates clearly that equity mutual funds have a better average return history compared to hybrid and debt mutual funds. However, equity funds come with high risk levels, too. Investors need to understand if the higher risk is worth the high returns based on their risk profile.
Factors That Affect SIP Returns
Some factors that affect the SIP returns include:
1. Market Cycles: Market cycles can be either bullish or bearish. In bullish market cycles, SIP investments can yield a lower number of units but at a higher NAV. Whereas, in bearish market cycles, a monthly SIP instalment may yield a higher number of units even if it's at a lower NAV.
However, the impact is often negated by the feature of rupee cost averaging in SIP investments, which averages out the purchasing price of each SIP unit across market cycles.
2. Fund type and Expense Ratio: Each category of mutual funds suits different investor profiles. SIP returns also depend on the chosen category. Equity funds offer higher SIP returns but at an increasingly high risk. Debt funds are known for their stability, but at lower SIP returns. Whereas, hybrid funds are a mix of both equity and debt, known to provide balanced SIP returns.
Do not forget to check the expense ratio of different funds. The expense ratio is the yearly maintenance fee charged to an investor by the mutual fund company. Small differences in expense ratios can also lead to massive differences across wealth corpus in the long term.
3. Duration of the investment: SIPs are ideal in the long term, as the benefits of compounding comes into play. The longer your investment remains invested, the higher the impact of compounding.
Conclusion
SIP investment in mutual funds promotes disciplined investing, thereby helping in long-term wealth creation. Choosing the right investment option requires examining different SIP returns and investing in the one that matches your investment criteria. However, to reap the maximum benefits of SIP returns, choose to invest for the long term.
Looking beyond mutual funds? Explore bonds and alternative fixed-income opportunities on Grip Invest – India’s one-stop destination for stable returns – and diversify your portfolio to reduce market volatility.
FAQs On SIP Returns In India
1. What is the average return of SIP in India?
Three different categories of mutual funds exist: equity, debt, and hybrid funds. The average return of SIPs in India depends on the category chosen. Over a period of 10 years, equity funds have delivered an average return of 13%, hybrid funds 8% and debt funds 6%.
2. Can SIP make you a millionaire in India?
SIP investments can make you a millionaire (INR 10 lakhs) if you choose the right fund and stay consistent and committed for the long term. For example, if investing in a debt fund, like Nippon India Credit Risk Fund, a INR 10,000 monthly SIP could create a corpus of more than INR 16 Lakhs over 10 years.
3. Which SIP gives the highest return in 2025?
Over the past year, credit risk funds- a debt fund category have delivered the highest average returns of 10.56% as per Morningstar data (as on 10th Sep, 2025).
References:
1. Outlook Money, accessed from: https://www.outlookmoney.com/invest/mutual-funds/small-town-genzs-trump-delhi-and-mumbai-in-driving-indias-mutual-fund-boom
2. Money Control, accessed from: https://www.moneycontrol.com/mutual-funds/nav/hdfc-large-cap-fund-growth/MZU009&seltab=cr&calc=ret
Want to stay at the top of your finances?
Join the community of 4 lakh+ investors and learn more about Grip Invest, the latest financial knick-knacks, and shenanigans in the world of investing.
Happy Investing!
Disclaimer - Investments in debt securities/municipal debt securities/securitised debt instruments are subject to risks, including delay and/ or default in payment. Read all the offer-related documents carefully. The investor is requested to take into consideration all the risk factors before the commencement of trading.
This communication is prepared by Grip Broking Private Limited (bearing SEBI Registration No. INZ000312836 and NSE ID 90319) and/or its affiliate/ group company(ies) (together referred to as “Grip”) and the contents of this disclaimer are applicable to this document and any and all written or oral communication(s) made by Grip or its directors, employees, associates, representatives and agents. This communication does not constitute advice relating to investing or otherwise dealing in securities and is not an offer or solicitation for the purchase or sale of any securities. Grip does not guarantee or assure any return on investments and accepts no liability for the consequences of any actions taken based on the information provided. For more details, please visit www.gripinvest.in
Registered Address - 106, II F, New Asiatic Building, H Block, Connaught Place, New Delhi 110001


